가우스 프로세스는 지도, 비지도 및 심지어 강화 학습 문제에 사용되어 왔으며 우아한 수학 이론으로 설명됩니다
또한 기능보다 사전 분포를 정의할 수 있는 직관적인 방법을 제공하기 때문에 개념적으로 매우 매력적입니다.
그리고 마지막으로, 가우스 프로세스는 베이지안 환경에서 공식화되기 때문에 불확실성에 대한 강력한 개념을 갖추고 있습니다.
다행히 Pyro는 pyro.contrib.gp 모듈에서 가우스 프로세스를 일부 지원합니다.
이 글의 목적은 이 모듈의 맥락에서 가우스 프로세스(GP)를 간략하게 소개하는 것입니다.
주로 Pyro에서 GP 인터페이스를 사용하는 방법에 초점을 맞출 것이며, GP에 대한 일반적인 자세한 내용은 독자에게 참고 자료를 참조하도록 안내할 것입니다.
참고 자료
2022.08.21 - [분석 Python/Pyro] - [Pyro] Application - 1. Bayesian Regression 이해하기
2022.08.28 - [분석 Python/Pyro] - [Pyro] Application - 2. Bayesian Regression 이해하기 2
2022.08.28 - [분석 Python/Pyro] - [Pyro] Application - 3. Gaussian Process 이해하기
2022.08.29 - [분석 Python/Pyro] - [Pyro] Application - 5. GP Bayesian Optimization
가우시안 프로세스란?

Gaussian Process는 Random(Stochastic) Process의 한 예
GP는 일종의 Bayesian Non-parametric method으로 설명되는데, 이때 Non-parametric이라는 것은 parameter의 부재를 의미하는 것이 아니라 parameter가 무한정 (infinite) 있다는 것을 의미
앞서 언급하였듯이 이 다변량 정규분포를 이루는 확률변수의 어떠한 부분집합에 대해서도 주변 분포와 조건부 분포 모두 정규분포를 따른다. GP는 여기서 한발 더 나아가서, 이러한 다변량 정규분포를 무한 차원으로 확장시키는 개념으로 생각하면 된다.
(https://greeksharifa.github.io/bayesian_statistics/2020/07/12/Gaussian-Process/)
Import Library
import os
import matplotlib.pyplot as plt
import torch
import numpy as np


import pyro
import pyro.contrib.gp as gp
import pyro.distributions as dist

from matplotlib.animation import FuncAnimation
from mpl_toolkits.axes_grid1 import make_axes_locatable

import seaborn as sns
from sklearn.metrics import confusion_matrix, ConfusionMatrixDisplay


smoke_test = "CI" in os.environ  # ignore; used to check code integrity in the Pyro repo
assert pyro.__version__.startswith('1.8.1')
pyro.set_rng_seed(0)
plot function
def plot(
    plot_observed_data=False,
    plot_predictions=False,
    n_prior_samples=0,
    model=None,
    kernel=None,
    n_test=500,
    ax=None,
):

    if ax is None:
        fig, ax = plt.subplots(figsize=(12, 6))
    if plot_observed_data:
        ax.plot(X.numpy(), y.numpy(), "kx")
    if plot_predictions:
        Xtest = torch.linspace(-0.5, 5.5, n_test)  # test inputs
        # compute predictive mean and variance
        with torch.no_grad():
            if type(model) == gp.models.VariationalSparseGP:
                mean, cov = model(Xtest, full_cov=True)
            else:
                mean, cov = model(Xtest, full_cov=True, noiseless=False)
        sd = cov.diag().sqrt()  # standard deviation at each input point x
        ax.plot(Xtest.numpy(), mean.numpy(), "r", lw=2)  # plot the mean
        ax.fill_between(
            Xtest.numpy(),  # plot the two-sigma uncertainty about the mean
            (mean - 2.0 * sd).numpy(),
            (mean + 2.0 * sd).numpy(),
            color="C0",
            alpha=0.3,
        )
    if n_prior_samples > 0:  # plot samples from the GP prior
        Xtest = torch.linspace(-0.5, 5.5, n_test)  # test inputs
        noise = (
            model.noise
            if type(model) != gp.models.VariationalSparseGP
            else model.likelihood.variance
        )
        cov = kernel.forward(Xtest) + noise.expand(n_test).diag()
        samples = dist.MultivariateNormal(
            torch.zeros(n_test), covariance_matrix=cov
        ).sample(sample_shape=(n_prior_samples,))
        ax.plot(Xtest.numpy(), samples.numpy().T, lw=2, alpha=0.4)

    ax.set_xlim(-0.5, 5.5)
Data
일단 여기서는 사용을 목적으로 하기 때문에 실제 분포를 가정하고 거기서 랜덤하게 샘플링해서 샘플을 얻는 것부터 시작합니다.

N = 20
X = dist.Uniform(0.0, 5.0).sample(sample_shape=(N,))
y = 0.5 * torch.sin(3 * X) + dist.Normal(0.0, 0.2).sample(sample_shape=(N,))

plot(plot_observed_data=True)  # let's plot the observed data

Define model
먼저 두 하이퍼파라미터의 varaince과 lenth scale의 값을 지정하여 RBF 커널을 정의합니다.
그런 다음 GPRegression 객체를 구성합니다. 여기서 우리는 위의 ϵ에 해당하는 또 다른 하이퍼 파라미터인 노이즈를 입력합니다.
kernel = gp.kernels.RBF(
    input_dim=1, variance=torch.tensor(6.0), lengthscale=torch.tensor(0.05)
)
gpr = gp.models.GPRegression(X, y, kernel, noise=torch.tensor(0.1))
이 GP 함수의 샘플이 이전에 어떻게 생겼는지 봅시다.
이것은 데이터를 조건화하기 전입니다.
이러한 함수의 부드러움, 수직 스케일 등의 모양은 GP 커널에 의해 제어됩니다.
샘플을 2개로 했기 때문에 2개의 선이 나온 것입니다.
plot(model=gpr, kernel=kernel, n_prior_samples=2)
_ = plt.ylim((-8, 8))
plot(model=gpr, kernel=kernel, n_prior_samples=10)
_ = plt.ylim((-8, 8))
예를 들어, 동일한 분산과 노이즈를 유지하고 길이 스케일을 늘리면 더 부드러운 함수 샘플을 볼 수 있습니다.
기존보다 20배 크게 length scale을 조정하면 스무스한 결과가 나옵니다.
kernel2 = gp.kernels.RBF(
    input_dim=1, variance=torch.tensor(6.0), lengthscale=torch.tensor(1)
)
gpr2 = gp.models.GPRegression(X, y, kernel2, noise=torch.tensor(0.1))
plot(model=gpr2, kernel=kernel2, n_prior_samples=2)
_ = plt.ylim((-8, 8))
이제 분산과 노이즈를 더 작게 만들면 수직 진폭이 더 작은 함수 샘플을 볼 수 있습니다.
즉 어떻게 가정하냐에 따라서 결과의 차이가 심해집니다.
kernel3 = gp.kernels.RBF(
    input_dim=1, variance=torch.tensor(1.0), lengthscale=torch.tensor(1)
)
gpr3 = gp.models.GPRegression(X, y, kernel3, noise=torch.tensor(0.01))
plot(model=gpr3, kernel=kernel3, n_prior_samples=2)
_ = plt.ylim((-8, 8))
Inference
위에서는 커널 하이퍼 파라미터를 수동으로 설정합니다.
데이터로부터 초 매개 변수를 학습하고 싶다면 추론을 해야 합니다.
즉 위에서 설정한 파라미터들을 학습해야 합니다.
가장 간단한 (conjugate) 경우 로그 주변 우도에 대한 경사 상승을 수행합니다.
pyro.contrib.gp에서는 PyTorch 최적화 도구를 사용하여 모델의 매개 변수를 최적화할 수 있습니다.
또한 쌍 모델과 가이드를 입력하고 ELBO 손실을 반환하는 손실 함수가 필요합니다
여기서는 학습을 하면서 학습된 결과를 모아두는 과정을 진행해서 나중에 시각화를 하는 용도로 사용합니다.
optimizer = torch.optim.Adam(gpr.parameters(), lr=0.005)
loss_fn = pyro.infer.Trace_ELBO().differentiable_loss
losses = []
variances = []
lengthscales = []
noises = []
num_steps = 2000 if not smoke_test else 2
for i in range(num_steps):
    variances.append(gpr.kernel.variance.item())
    noises.append(gpr.noise.item())
    lengthscales.append(gpr.kernel.lengthscale.item())
    optimizer.zero_grad()
    loss = loss_fn(gpr.model, gpr.guide)
    loss.backward()
    optimizer.step()
    losses.append(loss.item())
# let's plot the loss curve after 2000 steps of training
def plot_loss(loss):
plt.plot(loss)
plt.xlabel("Iterations")
_ = plt.ylabel("Loss") # supress output text
plot_loss(losses)
전체 x의 범위에서 각각 예측을 하고 그 결과에 대한 평균과 covariance 값을 저장해서 시각화를 한 모습입니다.
plot(model=gpr, plot_observed_data=True, plot_predictions=True)
gpr.kernel.variance.item(),gpr.kernel.lengthscale.item(),gpr.noise.item()
# (0.13067355751991272, 0.5015826225280762, 0.01979999430477619)
아래 그림은 학습을 하면서 점점 수렴되는 형태를 확인할 수 있습니다.
fig, ax = plt.subplots(figsize=(12, 6))


def update(iteration):
    pyro.clear_param_store()
    ax.cla()
    kernel_iter = gp.kernels.RBF(
        input_dim=1,
        variance=torch.tensor(variances[iteration]),
        lengthscale=torch.tensor(lengthscales[iteration]),
    )
    gpr_iter = gp.models.GPRegression(
        X, y, kernel_iter, noise=torch.tensor(noises[iteration])
    )
    plot(model=gpr_iter, plot_observed_data=True, plot_predictions=True, ax=ax)
    ax.set_title(f"Iteration: {iteration}, Loss: {losses[iteration]:0.2f}")


anim = FuncAnimation(fig, update, frames=np.arange(0, num_steps, 30), interval=100)
plt.close()

anim.save("../source/_static/img/gpr-fit.gif", fps=60)
Fit the model using MAP
위에서는 ELBO로 기존 분포를 잘 따라가게 학습을 하게 했고, 여기서는 MAP를 이용해서 학습을 하는 모습을 보여줍니다.
여기서는 각각의 파라미터에 사전 분포를 가정한다.
예를 들어 분산 같은 것들은 0보다는 항상 커야 하고, 크면 안 좋기 때문에 lognormal 같은 분포를 가정해볼 수 있다.
# Define the same model as before.
def plot_loss(loss):
    plt.plot(loss)
    plt.xlabel("Iterations")
    _ = plt.ylabel("Loss")  # supress output text


pyro.clear_param_store()
kernel = gp.kernels.RBF(
    input_dim=1, variance=torch.tensor(5.0), lengthscale=torch.tensor(10.0)
)
gpr = gp.models.GPRegression(X, y, kernel, noise=torch.tensor(1.0))

# note that our priors have support on the positive reals
gpr.kernel.lengthscale = pyro.nn.PyroSample(dist.LogNormal(0.0, 1.0))
gpr.kernel.variance = pyro.nn.PyroSample(dist.LogNormal(0.0, 1.0))

optimizer = torch.optim.Adam(gpr.parameters(), lr=0.005)
loss_fn = pyro.infer.Trace_ELBO().differentiable_loss
losses = []
num_steps = 2000 if not smoke_test else 2
for i in range(num_steps):
    optimizer.zero_grad()
    loss = loss_fn(gpr.model, gpr.guide)
    loss.backward()
    optimizer.step()
    losses.append(loss.item())

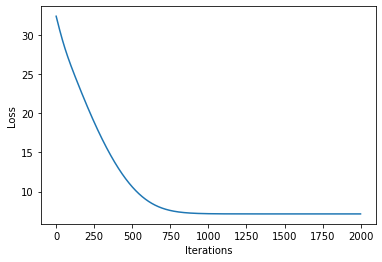
plot_loss(losses)
plot(model=gpr, plot_observed_data=True, plot_predictions=True)
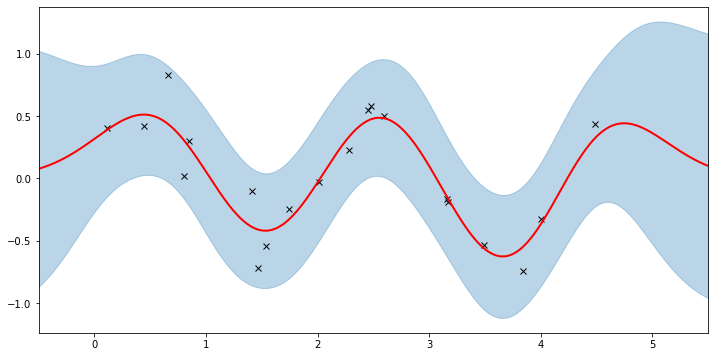
# tell gpr that we want to get samples from guides
gpr.set_mode("guide")
print("variance = {}".format(gpr.kernel.variance))
print("lengthscale = {}".format(gpr.kernel.lengthscale))
print("noise = {}".format(gpr.noise))

variance = 0.24472779035568237
lengthscale = 0.5217776894569397
noise = 0.042222216725349426
ELBO 결과
gpr.kernel.variance.item(),gpr.kernel.lengthscale.item(),gpr.noise.item()
# (0.13067355751991272, 0.5015826225280762, 0.01979999430477619)
Sparse GPs
대규모 데이터 세트 컴퓨팅의 경우 비용이 많이 드는 매트릭스 작업으로 인해 로그 한계 우도는 비용이 많이 듭니다
GP를 더 큰 데이터 세트에 사용할 수 있도록 하기 위해 소위 'sparse' 다양한 변형 방법이 개발되었습니다.
이것은 큰 연구 영역이고 pyro에서는 모든 세부 사항을 다루지 않는다고 합니다.
대신 pyro.contrib.gp에서 SparseGPRegression을 사용하여 이러한 방법을 사용하는 방법을 빠르게 보여줍니다.
N = 1000
X = dist.Uniform(0.0, 5.0).sample(sample_shape=(N,))
y = 0.5 * torch.sin(3 * X) + dist.Normal(0.0, 0.2).sample(sample_shape=(N,))
plot(plot_observed_data=True)
sparse GP를 사용하는 것은 위에서 사용한 기본 GP를 사용하는 것과 매우 유사합니다.
매개 변수(유도점)를 추가하면 됩니다.
유도 지점을 균일하게 초기화합니다. 학습 과정 중에 이러한 유도 지점의 위치도 최적화합니다.
예를 들어 아래는 임의로 균등하게 유도 지점을 표현했다면, sparse gp를 사용하면 유도 지점 위치도 최적화된다고 하는데, 아이디어는 GP에 대한 입력 데이터 포인트 x의 유효 수를 n에서 m(m <n)로 줄이는 것입니다. 여기서 m 포인트 세트를 유도 포인트라고 합니다.
이것은 유효 공분산 행렬 K를 더 작게 만들기 때문에 많은 유도 점 접근 방식은 계산 복잡성을 O(n3)에서 O(nm2)로 줄입니다. m이 작을수록 속도가 빨라집니다.
아주 무식하게 이해하면, n개의 샘플이 있으면 이걸 다 사용하는 것이 아니라 방법론에 따라서 효율적인 m개만 선택해서 학습시키겠다는 것으로 이해했습니다.(개인 의견)
N = 1000
X = dist.Uniform(0.0, 5.0).sample(sample_shape=(N,))
y = 0.5 * torch.sin(3 * X) + dist.Normal(0.0, 0.2).sample(sample_shape=(N,))
plot(plot_observed_data=True)

# initialize the inducing inputs
Xu = torch.arange(20.0) / 4.0


def plot_inducing_points(Xu, ax=None):
    for xu in Xu:
        g = ax.axvline(xu, color="red", linestyle="-.", alpha=0.5)
    ax.legend(
        handles=[g],
        labels=["Inducing Point Locations"],
        bbox_to_anchor=(0.5, 1.15),
        loc="upper center",
    )


plot_inducing_points(Xu, plt.gca())
여기서는 Xu 가 inducing point를 의미하고 총 20개에 대해서 지정했다.
# initialize the kernel and model
pyro.clear_param_store()
kernel = gp.kernels.RBF(input_dim=1)
# we increase the jitter for better numerical stability
sgpr = gp.models.SparseGPRegression(X, y, kernel, Xu=Xu, jitter=1.0e-5)

# the way we setup inference is similar to above
optimizer = torch.optim.Adam(sgpr.parameters(), lr=0.005)
loss_fn = pyro.infer.Trace_ELBO().differentiable_loss
losses = []
locations = []
variances = []
lengthscales = []
noises = []
num_steps = 2000 if not smoke_test else 2
for i in range(num_steps):
    optimizer.zero_grad()
    loss = loss_fn(sgpr.model, sgpr.guide)
    locations.append(sgpr.Xu.data.numpy().copy())
    variances.append(sgpr.kernel.variance.item())
    noises.append(sgpr.noise.item())
    lengthscales.append(sgpr.kernel.lengthscale.item())
    loss.backward()
    optimizer.step()
    losses.append(loss.item())
plot_loss(losses)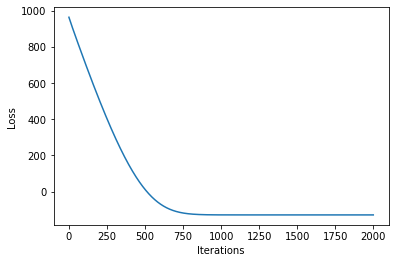
이제 최적화된 유도 포인트 위치와 함께 학습된 모델의 예측을 플롯할 수 있습니다.
plot(model=sgpr, plot_observed_data=True, plot_predictions=True)
plot_inducing_points(sgpr.Xu.data.numpy(), plt.gca())
모델이 데이터에 대한 합리적인 적합성을 학습하는 것을 볼 수 있습니다. 또한 유도 포인트 위치가 초기화와 상당히 다른지 확인할 수 있습니다. 아래 애니메이션을 통해 모델 학습 과정을 볼 수도 있습니다.
fig, ax = plt.subplots(figsize=(12, 6))


def update(iteration):
    pyro.clear_param_store()
    ax.cla()
    kernel_iter = gp.kernels.RBF(
        input_dim=1,
        variance=torch.tensor(variances[iteration]),
        lengthscale=torch.tensor(lengthscales[iteration]),
    )
    sgpr_iter = gp.models.SparseGPRegression(
        X,
        y,
        kernel_iter,
        Xu=torch.tensor(locations[iteration]),
        noise=torch.tensor(noises[iteration]),
        jitter=1.0e-5,
    )
    plot(model=sgpr_iter, plot_observed_data=True, plot_predictions=True, ax=ax)
    plot_inducing_points(sgpr_iter.Xu.data.numpy(), ax=ax)
    ax.set_title(f"Iteration: {iteration}, Loss: {losses[iteration]:0.2f}")
    fig.tight_layout()


anim = FuncAnimation(fig, update, frames=np.arange(0, num_steps, 30), interval=100)
plt.close()
anim.save("../source/_static/img/svgpr-fit.gif", fps=60)
현재 Pyro에서 구현된 세 가지 희소 근사치가 있습니다.
- "DTC"(결정적 훈련 조건부)
- "FITC"(완전히 독립적인 훈련 조건부)
- "VFE"(변형 자유 에너지)
기본적으로 SparseGPRegression은 "VFE"를 추론 방법으로 사용합니다. 다른 approx 플래그를 SparseGPRegression에 전달하여 다른 방법을 사용할 수 있습니다.
Xu 가 inducing point를 40개에 대해서 지정해서 해봤다.
Xu = torch.arange(40.0) / 8.0
pyro.clear_param_store()
kernel = gp.kernels.RBF(input_dim=1)
# we increase the jitter for better numerical stability
sgpr = gp.models.SparseGPRegression(X, y, kernel, Xu=Xu, jitter=1.0e-5)

# the way we setup inference is similar to above
optimizer = torch.optim.Adam(sgpr.parameters(), lr=0.005)
loss_fn = pyro.infer.Trace_ELBO().differentiable_loss
losses = []
locations = []
variances = []
lengthscales = []
noises = []
num_steps = 2000 if not smoke_test else 2
for i in range(num_steps):
    optimizer.zero_grad()
    loss = loss_fn(sgpr.model, sgpr.guide)
    locations.append(sgpr.Xu.data.numpy().copy())
    variances.append(sgpr.kernel.variance.item())
    noises.append(sgpr.noise.item())
    lengthscales.append(sgpr.kernel.lengthscale.item())
    loss.backward()
    optimizer.step()
    losses.append(loss.item())
plot(model=sgpr, plot_observed_data=True, plot_predictions=True)
plot_inducing_points(sgpr.Xu.data.numpy(), plt.gca())
더 느려지긴 했지만 더 많은 induicing point를 알게 되었다.
이걸 이용하면 추후에 앞으로 취합할 데이터를 모으는데도 활용할 수 있을까 하는 생각이 든다.(개인 생각)

More Sparse GPs
위의 GPRegression 및 SparseGPRegression은 모두 가우스 likelihood으로 제한됩니다.
Pyro는 GP에 다른 likelihood를 사용할 수 있습니다.
예를 들어 분류 문제에 베르누이 likelihoo을 사용할 수 있지만 추론 문제는 더 어려워집니다.
이 섹션에서는 비가우스 likelihood을 처리할 수 있는 VariationalSparseGP 모듈을 사용하는 방법을 보여줍니다.
그래서 우리는 위에서 한 것과 비교할 수 있습니다. 우리는 여전히 가우스 우도(likelihood)를 사용할 것입니다.
요점은 likelihood 아래에서 행해지고 있는 추론이 다른 가능성을 뒷받침할 수 있다는 것입니다.
Gaussian Likelihood
# initialize the inducing inputs
Xu = torch.arange(10.0) / 2.0

# initialize the kernel, likelihood, and model
pyro.clear_param_store()
kernel = gp.kernels.RBF(input_dim=1)
likelihood = gp.likelihoods.Gaussian()
# turn on "whiten" flag for more stable optimization
vsgp = gp.models.VariationalSparseGP(
    X, y, kernel, Xu=Xu, likelihood=likelihood, whiten=True
)

# instead of defining our own training loop, we will
# use the built-in support provided by the GP module
num_steps = 1500 if not smoke_test else 2
losses = gp.util.train(vsgp, num_steps=num_steps)
plot_loss(losses)
plot(model=vsgp, plot_observed_data=True, plot_predictions=True)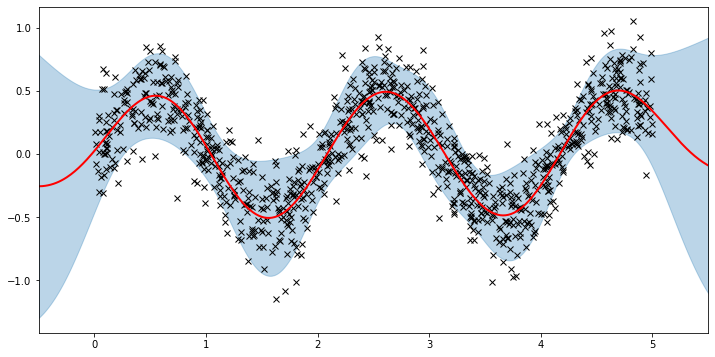
GP Classification
이제 다중 클래스 분류를 위한 GP 분류에 대해 간략하게 설명합니다.
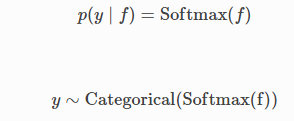
GP 회귀와 비교하여 모델 사양에 필요한 두 가지 주요 변경 사항은 다음과 같습니다.
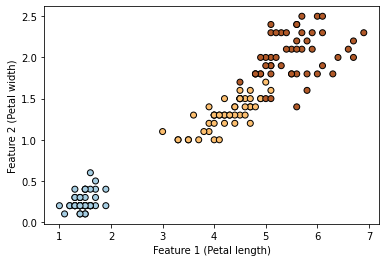
이 예에서는 Iris 데이터 세트를 사용할 것입니다.
우리는 세 가지 클래스를 setosa의 경우 0번, virginicolor의 경우 1번, virginica의 경우 2번으로 인코딩할 것입니다.
또한, 예제를 단순하게 유지하기 위해 두 가지 입력 기능(꽃잎 길이와 꽃잎 너비)만 고려할 것입니다.
df = sns.load_dataset("iris")
# only take petal length and petal width
X = torch.from_numpy(
    df[df.columns[2:4]].values.astype("float32"),
)
df["species"] = df["species"].astype("category")
# encode the species as 0, 1, 2
y = torch.from_numpy(df["species"].cat.codes.values.copy())
plt.scatter(X[:, 0], X[:, 1], c=y, cmap=plt.cm.Paired, edgecolors=(0, 0, 0))
plt.xlabel("Feature 1 (Petal length)")
_ = plt.ylabel("Feature 2 (Petal width)")
Multiclass Likelihood를 사용합니다.
kernel = gp.kernels.RBF(input_dim=2)
pyro.clear_param_store()
likelihood = gp.likelihoods.MultiClass(num_classes=3)
# Important -- we need to add latent_shape argument here to the number of classes we have in the data
model = gp.models.VariationalGP(
    X,
    y,
    kernel,
    likelihood=likelihood,
    whiten=True,
    jitter=1e-03,
    latent_shape=torch.Size([3]),
)
num_steps = 1000
loss = gp.util.train(model, num_steps=num_steps)
plot_loss(loss)
multiclass에 대한 likelihood를 계산
mean, var = model(X)
y_hat = model.likelihood(mean, var)

print(f"Accuracy: {(y_hat==y).sum()*100/(len(y)) :0.2f}%")
# Accuracy: 96.00%
Muticlass Likelihood
(https://docs.pyro.ai/en/1.5.0/_modules/pyro/contrib/gp/likelihoods/multi_class.html#MultiClass)
평균과 분산을 가지고 어떻게 쓰는지 확인하였습니다.
각각의 평균과 분산 값을 가지고 정규 분포를 가정하고 샘플링을 하게 됩니다.
그러면 이 샘플링된 결과가 즉 우리가 알고 있는 각각의 logit값이 됩니다.
각각의 logit값을 가지고 다시 한번 카테고리 분포라고 가정을 하고 샘플링을 하게 됩니다.
class MultiClass(Likelihood):
    """
    Implementation of MultiClass likelihood, which is used for multi-class
    classification problems.

    MultiClass likelihood uses :class:`~pyro.distributions.Categorical`
    distribution, so ``response_function`` should normalize its input's rightmost axis.
    By default, we use `softmax` function.

    :param int num_classes: Number of classes for prediction.
    :param callable response_function: A mapping to correct domain for MultiClass
        likelihood.
    """
    def __init__(self, num_classes, response_function=None):
        super().__init__()
        self.num_classes = num_classes
        self.response_function = _softmax if response_function is None else response_function

[docs]    def forward(self, f_loc, f_var, y=None):
        r"""
        Samples :math:`y` given :math:`f_{loc}`, :math:`f_{var}` according to

            .. math:: f & \sim \mathbb{Normal}(f_{loc}, f_{var}),\\
                y & \sim \mathbb{Categorical}(f).

        .. note:: The log likelihood is estimated using Monte Carlo with 1 sample of
            :math:`f`.

        :param torch.Tensor f_loc: Mean of latent function output.
        :param torch.Tensor f_var: Variance of latent function output.
        :param torch.Tensor y: Training output tensor.
        :returns: a tensor sampled from likelihood
        :rtype: torch.Tensor
        """
        # calculates Monte Carlo estimate for E_q(f) [logp(y | f)]
        f = dist.Normal(f_loc, f_var.sqrt())()
        if f.dim() < 2:
            raise ValueError("Latent function output should have at least 2 "
                             "dimensions: one for number of classes and one for "
                             "number of data.")

        # swap class dimension and data dimension
        f_swap = f.transpose(-2, -1)  # -> num_data x num_classes
        if f_swap.size(-1) != self.num_classes:
            raise ValueError("Number of Gaussian processes should be equal to the "
                             "number of classes. Expected {} but got {}."
                             .format(self.num_classes, f_swap.size(-1)))
        if self.response_function is _softmax:
            y_dist = dist.Categorical(logits=f_swap)
        else:
            f_res = self.response_function(f_swap)
            y_dist = dist.Categorical(f_res)
        if y is not None:
            y_dist = y_dist.expand_by(y.shape[:-f.dim() + 1]).to_event(y.dim())
        return pyro.sample(self._pyro_get_fullname("y"), y_dist, obs=y)
model.kernel.variance.item(),model.kernel.lengthscale.item()
# (18.433822631835938, 1.349475383758545)
cm = confusion_matrix(y, y_hat, labels=[0, 1, 2])
ConfusionMatrixDisplay(cm).plot()
mean_= mean.detach().numpy().transpose()
sd_ = var.sqrt().detach().numpy().transpose()
fig, ax = plt.subplots(figsize=(12, 6))
ax.plot(mean.detach().numpy().transpose())
for i in range(mean_.shape[1]) :
    ax.fill_between(
                np.arange(150),
                (mean_ - 2.0 * sd_)[:,i],
                (mean_ + 2.0 * sd_)[:,i],
                color="C0",
                alpha=0.3,
        )
아래 그림은 각 인덱스에 대해서 3개의 클래스에 대한 평균값과 분산을 이용해서 불확실성을 표현해봤습니다.
이런 결괏값들은 결국 각 행의 각 클래스에 대한 안정성을 표현해줄 수 있다고 생각합니다.
그래서 그 결과에 대한 신뢰성을 보여줄 수 있습니다.

xs = torch.linspace(X[:, 0].min() - 0.5, X[:, 0].max() + 0.5, steps=100)
ys = torch.linspace(X[:, 1].min() - 0.5, X[:, 1].max() + 0.5, steps=100)
xx, yy = torch.meshgrid(xs, ys, indexing="xy")

with torch.no_grad():
    mean, var = model(torch.vstack((xx.ravel(), yy.ravel())).t())
    Z = model.likelihood(mean, var)
def plot_pred_2d(arr, xx, yy, contour=False, ax=None, title=None):
if ax is None:
fig, ax = plt.subplots()
image = ax.imshow(
arr,
interpolation="nearest",
extent=(xx.min(), xx.max(), yy.min(), yy.max()),
aspect="equal",
origin="lower",
cmap=plt.cm.PuOr_r,
)
if contour:
contours = ax.contour(
xx,
yy,
torch.sigmoid(mean).reshape(xx.shape),
levels=[0.5],
linewidths=2,
colors=["k"],
)
divider = make_axes_locatable(ax)
cax = divider.append_axes("right", size="5%", pad=0.1)
ax.get_figure().colorbar(image, cax=cax)
if title:
ax.set_title(title)fig, ax = plt.subplots(ncols=3, figsize=(16, 4))
for cl in [0, 1, 2]:
plot_pred_2d(
mean[cl, :].reshape(xx.shape), xx, yy, ax=ax[cl], title=f"f (class {cl})"
)
p_class = torch.nn.functional.softmax(mean, dim=0)fig, ax = plt.subplots(ncols=3, figsize=(16, 4))
for cl in [0, 1, 2]:
plot_pred_2d(
p_class[cl, :].reshape(xx.shape), xx, yy, ax=ax[cl], title=f" p(class {cl})"
)
plot_pred_2d(Z.reshape(xx.shape), xx, yy, title="Prediction")

실제 결과와 예측된 결과를 보면 영역이 확실한 부분들은 잘 표현되어있습니다.
Combining Kernels
이제 서로 다른 커널을 결합하는 방법을 살펴봅니다.
선형 추세와 약간의 주기성을 포함하는 간단한 데이터 세트를 생성합니다.
X = torch.linspace(-5, 5, 100)
y = torch.sin(X * 8) + 2 * X + 4 + 0.2 * torch.rand_like(X)
plt.scatter(X, y)
plt.show()

데이터의 추세를 명확하게 볼 수 있습니다. 다음과 같이 결합된 커널을 사용합니다.
Linear + RBF * Periodic
선형성을 띄고 있고, 주기를 띄고 있으니 기존 rbf에 결합하는 형태로 할 수 있습니다.
pyro.clear_param_store()
linear = gp.kernels.Linear(
    input_dim=1,
)
periodic = gp.kernels.Periodic(
    input_dim=1, period=torch.tensor(0.5), lengthscale=torch.tensor(4.0)
)
rbf = gp.kernels.RBF(
    input_dim=1, lengthscale=torch.tensor(0.5), variance=torch.tensor(0.5)
)
k1 = gp.kernels.Product(kern0=rbf, kern1=periodic)

k = gp.kernels.Sum(linear, k1)
model = gp.models.GPRegression(
    X=X,
    y=y,
    kernel=k,
    jitter=2e-3,
)

loss = gp.util.train(model)
plot_loss(loss
plt.scatter(X, y, s=50, alpha=0.5)

with torch.no_grad():
    mean, var = model(X)
_ = plt.plot(X, mean, color="C3", lw=2)

이런 점은 그냥 딥러닝만 사용하면 학습을 하긴 했지만, 데이터가 많아야 할 수 있던 것을 데이터의 패턴을 보고 가정을 추가해주면 학습을 해줄 수 있다는 게 매력적이라 생각합니다.
커널 조합이 데이터의 고유한 추세와 주기성을 학습하는 데 상당히 잘한다는 것을 알 수 있습니다.
pyro.contrib.gp 모듈에 대한 자세한 내용은 문서를 참조하십시오.
For an example on binary classification see here, for an example on deep kernel learning see here, and for an advanced example for GP classification using deep kernel learning see here.
정리
가우시안 프로세스에 회귀 분석 말고, 가우스 likelihood를 정의하지 않고도 다양한 문제에 비가우스 likelihood 방식으로 사용할 수 있다는 것이 매력적이라고 생각한다.
특히 이러한 가정들은 결국 데이터가 부족한 상황에서 효과적이라 생각한다.
데이터가 많아도 내가 원하는 방향성으로 학습할 때도 좋을 것 같기도 하다.
다만 모든 것이 결국 샘플링을 기반으로 하다 보니 실제 딥러닝 방식보다는 정확도가 떨어지게 나올 수 있다는 단점이 있지만, 값 자체에 대한 불확실성도 표현해주기 때문에 그런 면에서는 메리트가 있어 보인다.
Reference
https://www.google.com/imgres?imgurl=x-raw-image%3A%2F%2F%2F1681dc496ad2cb3a49171638a756f88e0848bdefb3c18d54dede7011fa40bcef&imgrefurl=http%3A%2F%2Fgpss.cc%2Fgpss17%2Fslides%2Fgp-approx-new.pdf&tbnid=OsvSakncgRYhaM&vet=12ahUKEwjw5Ob5-ej5AhX1xIsBHTnlDHYQMygEegUIARCyAQ..i&docid=cNGLhV_nP7uaCM&w=2600&h=1776&q=sparse%20gp%20inducing%20point&ved=2ahUKEwjw5Ob5-ej5AhX1xIsBHTnlDHYQMygEegUIARCyAQ
http://pyro.ai/examples/gp.html
https://greeksharifa.github.io/bayesian_statistics/2020/07/12/Gaussian-Process/
'분석 Python > Pyro' 카테고리의 다른 글
| [Pyro] Application - 5. GP Bayesian Optimization (0) | 2022.08.29 |
|---|---|
| [Pyro] Application - 4. Gaussian Process Latent Variable Model(GPLVM) (0) | 2022.08.29 |
| [Pyro] Application - 2. Bayesian Regression 이해하기 2 (0) | 2022.08.28 |
| [Pyro] Application - 1. Bayesian Regression 이해하기 (1) | 2022.08.21 |
| [Pyro] 개념 파악 및 실습으로 알아보기 (1) | 2022.08.20 |