Torch를 프레임워크를 사용한 Neural Network를 eXAI 알고리즘 중 하나인 SHAP을 사용해서 적용해보기
import torch, torchvision
from torchvision import datasets, transforms
from torch import nn, optim
from torch.nn import functional as F
import numpy as np
import shap
import pandas as pd
Myutils는 개인적으로 분석하면서 모아놓은 모음집
from Myutils import *
from sklearn.compose import ColumnTransformer
from sklearn.pipeline import Pipeline
데이터 간단한 전처리 진행
scikit-learn을 활용하여 Pipeline을 구성하여 전처리하기
trans_info = {}
Steps = [
    ("NumericImpute", MissingHandling(method="mean",
                               trans_info= trans_info,
                               var= num_var)) ,
    ("numeric", NumericHandler(method="normal",
                               trans_info= trans_info,
                               num_var=num_var)),
]
pipe = Pipeline(Steps)
pipe.fit(Train_X)
Train_X = pipe.transform(Train_X)
Test_X = pipe.transform(Test_X)pytorch로 Neural Network 짜고, 학습시키기
class Net(nn.Module) :
    def __init__(self) :
        super(Net,self).__init__()
        self.fc = nn.Sequential(
            nn.Linear(33,20),
            nn.LeakyReLU(),
            nn.Linear(20,15),
            nn.LeakyReLU(),
            nn.Linear(15,2)
        )
    def forward(self,x) :
        x = self.fc(x)
        return x
pytorch를 data loader에 적용할 새로운 클래스를 만들기
새로운 데이터에 적용하기 위해서 클래스를 만들어 봤다.
여기서 오로지 override 해줘야 하는 method는 2개
- __len__ : 인풋의 개수를 반환하는 것
- __getitem__ : [인풋, 타겟] 형태로 개별 관측치를 내보냄. 무조건 인덱스로 뽑게 해야 함.
from torch.utils.data import Dataset, DataLoader, random_split

class TabularDataset(Dataset) :
    def __init__(self, X , y) :
        self.X = X
        self.y = y
    def __len__(self) :
        return len(self.X)
    def __getitem__(self,idx) :
        if isinstance(idx, torch.Tensor):
            idx = idx.tolist()
        return [self.X.iloc[idx].values, self.y[idx]]
이렇게 해주면 새로운 데이터(X, y)에 대해서 처리를 해주고 아래와 같이 사용하면 된다.
trainset = TabularDataset(Train_X , Train_y)
testset = TabularDataset(Test_X , Test_y)

trainloader = DataLoader(trainset, batch_size=1000, shuffle=True)
testloader = DataLoader(testset, batch_size=1000, shuffle=False)
gpu 있으면 잡아주기
device = torch.device("cuda:0" if torch.cuda.is_available() else "cpu")간단한 학습 코드
model = Net().to(device)
criterion = nn.CrossEntropyLoss()
optimizer = optim.Adam(model.parameters(), weight_decay=0.0001)
n_epochs = 100
# Train the net
loss_per_iter = []
loss_per_batch = []
for epoch in range(n_epochs):
    print(f"Epoch : {epoch}", end="\r")
    running_loss = 0.0
    for i, (inputs, labels) in enumerate(trainloader):
        inputs = inputs.to(device)
        labels = labels.type(torch.LongTensor).to(device)
        # Zero the parameter gradients
        optimizer.zero_grad()
        # Forward + backward + optimize
        outputs = model(inputs.float())
        loss = criterion(outputs, labels)
        loss.backward()
        optimizer.step()
        # Save loss to plot
        running_loss += loss.item()
        loss_per_iter.append(loss.item())
    loss_per_batch.append(running_loss / (i + 1))
    running_loss = 0.0
학습 결과 시각화
# Comparing training to test
dataiter = iter(testloader)
inputs, labels = dataiter.next()
inputs = inputs.to(device)
labels = labels.type(torch.LongTensor).to(device)
outputs = model(inputs.float())
print("Training:", loss_per_batch[-1])
print("Test", criterion(outputs, labels).detach().cpu().numpy())
import matplotlib.pyplot as plt
# Plot training loss curve
plt.plot(np.arange(len(loss_per_iter)), loss_per_iter, "-", alpha=0.5, label="Loss per epoch")
plt.xlabel("Number of epochs")
plt.ylabel("Loss")
plt.legend()
plt.show()
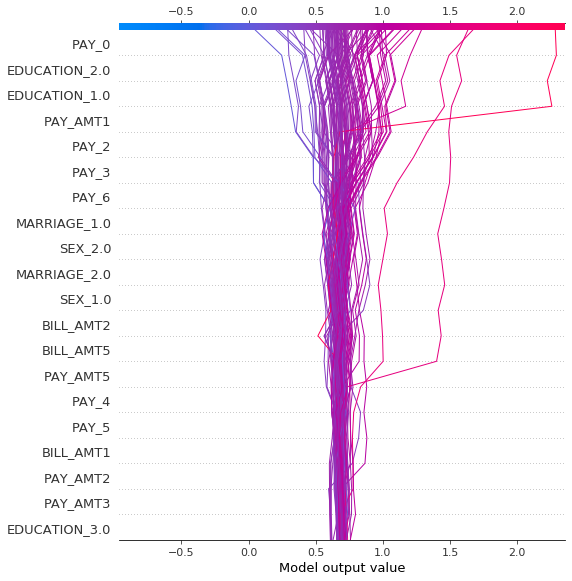
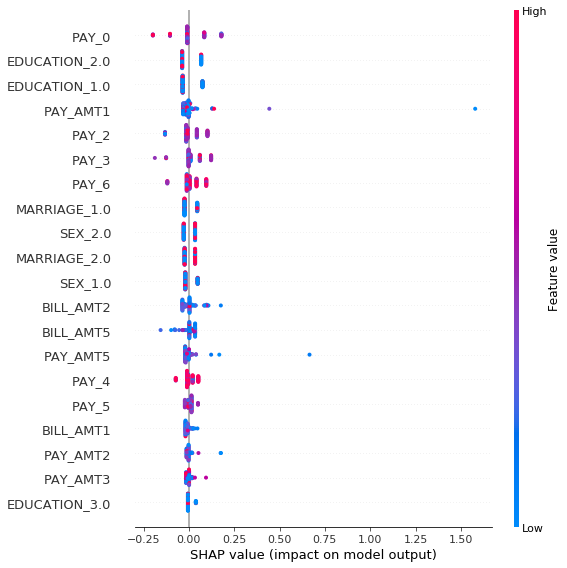
이제 학습된 네트워크에 shap을 적용하여 일단 그림을 그려보기. (해석은 다른 곳에서)
Test_X_np = Test_X.values
torch_data = torch.from_numpy(Test_X_np).to(device).float()
explainer_shap = shap.DeepExplainer(model, torch_data)
shap_values = explainer_shap.shap_values(torch_data) ## very very slow
shap_values를 뽑아내는데, 굉장히 느림... 왜 이렇게 느린지는 모르겠음 저번에 tensorflow version 1로 한 것에서는 이 정도는 아니었던 것 같음.
https://data-newbie.tistory.com/420
Analyzing TensorFlow version 1 into LIME or SHAP in tabular data
딥러닝 모델들이 black-box 형태의 모델이기 때문에 해석을 하는 데 있어서 사람들의 많은 요구사항들이 있다. 그중에서 유명한 것은 eli5, shap, lime, skater와 같은 알고리즘들을 사용하고, 만약 이러한 알고리..
data-newbie.tistory.com
## force_plot
shap.initjs()

shap.force_plot(explainer_shap.expected_value[0],
                shap_values[0],
                feature_names=Test_X.columns)
## decision plot
Test_X_np= Test_X.values
c = 0
i = 2
shap.decision_plot( explainer_shap.expected_value[c],
                   shap_values[c],
                   Train_X.values,
                   feature_names=Train_X.columns.tolist()
                  )
## summary plot
shap.summary_plot(shap_values[c], Train_X.values[:100], feature_names=Test_X.columns)
shap.summary_plot(shap_values[c], Train_X.values[:100],
                  feature_names=Test_X.columns,plot_type='bar')
## dependence_plot
shap.dependence_plot(0 , shap_values[c], Test_X)
Reference
https://averdones.github.io/reading-tabular-data-with-pytorch-and-training-a-multilayer-perceptron/
Reading tabular data in Pytorch and training a Multilayer Perceptron
Pytorch is a library that is normally used to train models that leverage unstructured data, such as images or text. However, it can also be used to train models that have tabular data as their input. This is nothing more than classic tables, where each row
averdones.github.io
https://pytorch.org/tutorials/beginner/data_loading_tutorial.html
Writing Custom Datasets, DataLoaders and Transforms — PyTorch Tutorials 1.4.0 documentation
Note Click here to download the full example code Writing Custom Datasets, DataLoaders and Transforms Author: Sasank Chilamkurthy A lot of effort in solving any machine learning problem goes in to preparing the data. PyTorch provides many tools to make dat
pytorch.org
'분석 Python > Pytorch' 카테고리의 다른 글
| [Pytorch] Pytorch를 Keras처럼 API 호출 하는 방식으로 사용하는 방법 (0) | 2020.08.25 |
|---|---|
| [Pytorch] LSTM AutoEncoder for Anomaly Detection (3) | 2020.08.23 |
| Pytorch 1.6 Release Note Information (0) | 2020.08.21 |
| [Pytorch] MixtureSameFamily 을 사용해서 bimodal distribution 만들기 (0) | 2020.05.05 |
| [Pytorch] 1.5.0 버전 설치하기 (0) | 2020.05.05 |