728x90
그림을 위에서는 2개로 나 누가 밑에는 그냥 1개의 직사각형으로 만들고 싶어서 찾아보고 공유한다.
아래 그림에서는 타겟별 train 확률 값 box plot과 test 확률 값 box plot 그리고 학습 곡선을 그리고 싶었다.
fig , axes = plt.subplots(nrows=2 ,ncols=2,
                          figsize=(20,10) )
plt.subplots_adjust(left=0.05, bottom=0.01, right=0.99,
                    top=0.99, wspace=None, hspace=0.2)
ax = axes.flatten()
sns.boxplot(x="t", y="prob", data=DD , ax = ax[0])
ax[0].set_title("train : {:.3f}".format(AUC) , fontsize= 20)
sns.boxplot(x="t", y="prob", data=DD , ax = ax[1])
ax[1].set_title("test : {:.3f}".format(AUC) , fontsize= 20)
ax3 = plt.subplot(212)
ax3.plot(np.arange(len(_Loss_)), _Loss_ )
ax3.set_title(msg, fontsize= 20)
plt.show()
업그레이드 버전
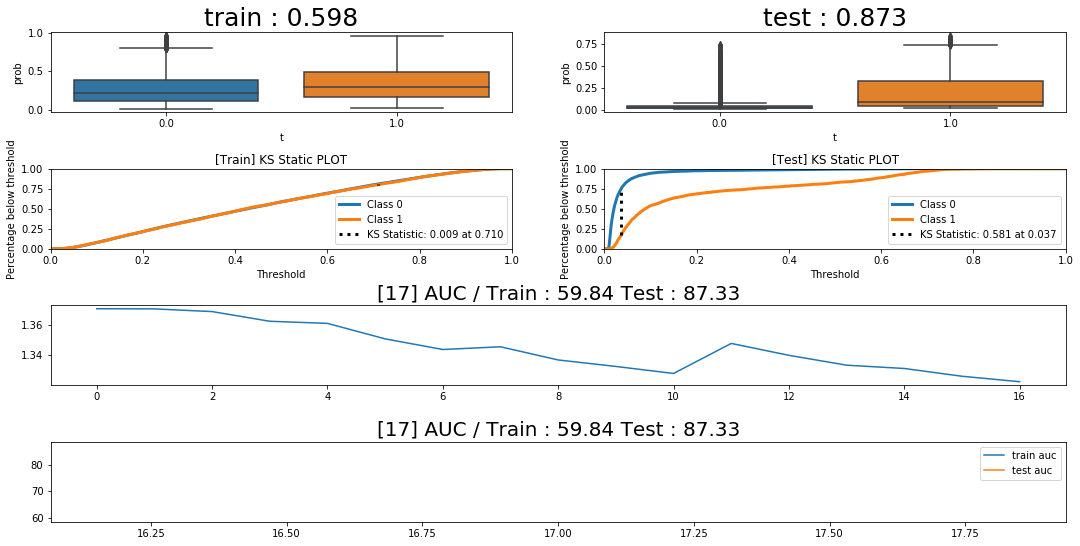
여기서는 좀 더 다양한 정보를 담기로 했다.
추가적으로 한 것은 ks plot 과 epoch 당 auc 가 어떻게 보이는지 같이 시각화하였다.
fig , axes = plt.subplots(nrows=4 ,ncols=2,
                  figsize=(15,8) )
plt.subplots_adjust(left=0.05, bottom=0.1, right=0.99,
                    top=0.95, wspace=None, hspace=0.3)
ax = axes.flatten()
sns.boxplot(x="t", y="prob", data=trainDD, ax = ax[0])
ax[0].set_title("train : {:.3f}".format(trainAUC), fontsize= 25)
sns.boxplot(x="t", y="prob", data=testDD, ax = ax[1])
ax[1].set_title("test : {:.3f}".format(testAUC), fontsize= 25)
skplt.metrics.plot_ks_statistic(Train_y.values, probs ,
                                ax = ax[2] ,
                                title = "[Train] KS Static PLOT")
skplt.metrics.plot_ks_statistic(Test_y.values, testprobs ,
                                ax = ax[3],
                                title = "[Test] KS Static PLOT")

ax3 = plt.subplot(413)
plt.subplots_adjust(left=0.05, bottom=0.1, right=0.99,
                    top=0.95, wspace=None, hspace=0.7)
ax3.plot(_Epoch_ , _Loss_ )
ax3.set_title(msg, fontsize= 20)
_Epoch2_.append(epoch)
_trAUC_.append(100*trainAUC)
_teAUC_.append(100*testAUC)
ax4 = plt.subplot(414)
ax4.plot(_Epoch2_ , _trAUC_ , label = "train auc")
ax4.plot(_Epoch2_ , _teAUC_ , label = "test auc")
ax4.legend()
msg = "[{}] AUC / Train : {:.2f} Test : {:.2f}".format(epoch ,
                                                       100*trainAUC ,
                                                       100*testAUC
                                                      )
ax4.set_title(msg, fontsize= 20)
'분석 Python > Visualization' 카테고리의 다른 글
| [ Python ] density plot과 count ratio plot 그리기 (0) | 2020.02.01 |
|---|---|
| [ Python ] 유용한 시각화 함수들 모음 (boxplot, scatter plot, plotly.express, etc) (0) | 2020.01.14 |
| [ Python ] 이미지들을 동영상으로 만들기 (images -> mp4) (0) | 2020.01.11 |
| [Python] tqdm nested progress bar 해보기 (0) | 2020.01.04 |
| [ Python ] 2개 모델 확률값 사후 해석 시각화 그려보기 (0) | 2020.01.04 |