https://towardsdatascience.com/four-useful-functions-for-exploring-data-in-python-33b53288cdd8
Four Useful Functions For Exploring Data in Python
Exploring and Visualizing Data in Python
towardsdatascience.com
파이썬은 시각화 함수가 seaborn 같은 것이 있지만, R의 ggplot에 비해 먼가 아쉬운 점이 있는 것 같다.
그래서 먼가 유용한 함수들을 따로 만들어 넣고 사용해야 한다.
위의 글에서는 시각화를 하는 데 있어서 유용한 함수들을 몇 개 소개하고 있다.
import pandas as pd
df = pd.read_csv('./../../Data/bank.csv')
print(df.head())
1. COUNTER
데이터의 빈도를 파악하는데 있어서 보통 필자는 pandas series 함수에서 value_counts를 사용한다.
해당 함수에서는 특점 범주형 변수에 대해서 빈도를 세주는 것을 제공한다.
def return_counter(data_frame, column_name, limit):
    from collections import Counter
    print(dict(Counter(data_frame[column_name].values).most_common(limit)))


return_counter(df , 'job' , 5)

2. SUMMARY STATISTICS
이 함수는 특정 범주형 변수에 대해서 특정 수치형 변수에 대해서 평균과 편차를 보여준다.
보통 이 것을 쓰려면 pandas에서 group_by를 통해서 할 수 있긴 하다.
def return_statistics(data_frame, categorical_column, numerical_column):
    mean = []
    std = []
    field = []
    for i in set(list(data_frame[categorical_column].values)):
        new_data = data_frame[data_frame[categorical_column] == i]
        field.append(i)
        mean.append(new_data[numerical_column].mean())
        std.append(new_data[numerical_column].std())
    df = pd.DataFrame({'{}'.format(categorical_column): field, 'mean {}'.format(numerical_column): mean, 'std in {}'.format(numerical_column): std})
    df.sort_values('mean {}'.format(numerical_column), inplace = True, ascending = False)
    df.dropna(inplace = True)
    return df
stats = return_statistics(df, 'job', 'age')
print(stats.head())
SUMMARY STATISTICS V2
장점은 categorical 과 numeric과 가능하게 만들어 봤다.
그리고 더 다양한 정보를 줄 수 있게 해 봤다.
def return_statistics_v2(df, categorical_column, num_or_cat):
    a = df[[categorical_column, numerical_column]].groupby(categorical_column).describe().reset_index()
    a.columns = [' '.join(col).strip() for col in a.columns.values]
    return a

3. Boxplot
특정 범주형 변수에 대해서 특정 연속형 변수에 대해서 시각화를 하고 limit를 설정할 수 있다.
def get_boxplot_of_categories(data_frame, categorical_column, numerical_column, limit):
    import seaborn as sns
    import matplotlib.pyplot as plt
    from collections import Counter
    keys = []
    for i in dict(Counter(df[categorical_column].values).most_common(limit)):
        keys.append(i)
    print(keys)

    df_new = df[df[categorical_column].isin(keys)]
    sns.boxplot(x = df_new[categorical_column], y = df_new[numerical_column])
get_boxplot_of_categories(df, 'job', 'balance', 4)
seaborn boxplot과 catplot을 사용해서 시각화해봤다.
# ["age", "balance"]
def seaborn_boxplot(df= None , numeric_types= None , color= None , col = None , options = None) :
    import seaborn as sns
    import matplotlib.pyplot as plt
    def gather( df, key, value, cols ):
        id_vars = [ col for col in df.columns if col not in cols ]
        id_values = cols
        var_name = key
        value_name = value
        return pd.melt( df, id_vars, id_values, var_name, value_name )
    numeric_gather = gather( df , 'key', 'value', numeric_types )
    if options is None :
        options = {}
    fig = plt.figure(**options)
    if col is None :
        ax = sns.boxplot(x="key", y="value", hue=color,
                         data=numeric_gather, palette="Set3")
        box = ax.get_position()
        ax.set_position([box.x0, box.y0, box.width * 0.8, box.height])
        ax.legend(loc='center left', bbox_to_anchor=(1, 0.5))
    else :
        sns.catplot(x="key", y="value", hue=color, col = col ,
                    data=numeric_gather, palette="Set3",
                    kind = "box")
    plt.show()

Plotly Boxplot Function
좀 더 업그레이드해봤다.
해보고 나니 이쁘게 잘 되는 것 같다.
def plotly_boxplot(df , numeric_types , color  , row = None) :
    import plotly.express as px
    import pandas as pd
    def gather( df, key, value, cols ):
        id_vars = [ col for col in df.columns if col not in cols ]
        id_values = cols
        var_name = key
        value_name = value
        return pd.melt( df, id_vars, id_values, var_name, value_name )
    numeric_gather = gather( df , 'key', 'value', numeric_types )
    fig = px.box(numeric_gather, x="key", y="value",
                 facet_col="key" ,color = color ,
                 facet_row=row )
    fig.update_yaxes(showticklabels=True , matches=None)
    fig.update_xaxes(showticklabels=True , matches=None)
    fig.show()


4. Scatter Plot
특정 범주형 변수의 특정 범수에 대해서 수치형 변수를 수치화하는 시각화 함수이다.
def get_scatter_plot_category(data_frame, categorical_column, categorical_value,
                              numerical_column_one, numerical_column_two):
    import matplotlib.pyplot as plt
    import seaborn as sns
    df_new = data_frame[data_frame[categorical_column] == categorical_value]
    sns.set()
    plt.scatter(x= df_new[numerical_column_one], y = df_new[numerical_column_two])
    plt.title("{} = {}".format(categorical_column , categorical_value))
    plt.xlabel(numerical_column_one)
    plt.ylabel(numerical_column_two)


get_scatter_plot_category(df, 'job', 'unemployed', 'balance', 'duration')
plotly scatter르 구현해보기
plotly.express 가 참 편리한 것 같다!
def plotly_scatter(df , numerical_column_one, numerical_column_two ,
                   color = None  , row = None , col =None) :
    import plotly.express as px
    import pandas as pd
    fig = px.scatter(df,
                     x=numerical_column_one,
                     y=numerical_column_two,
                     facet_col=col,
                     color = color ,
                     facet_row=row , height = 600)
    fig.update_yaxes(showticklabels=True , matches=None ,)
    fig.update_xaxes(showticklabels=True , matches=None)
    fig.show()

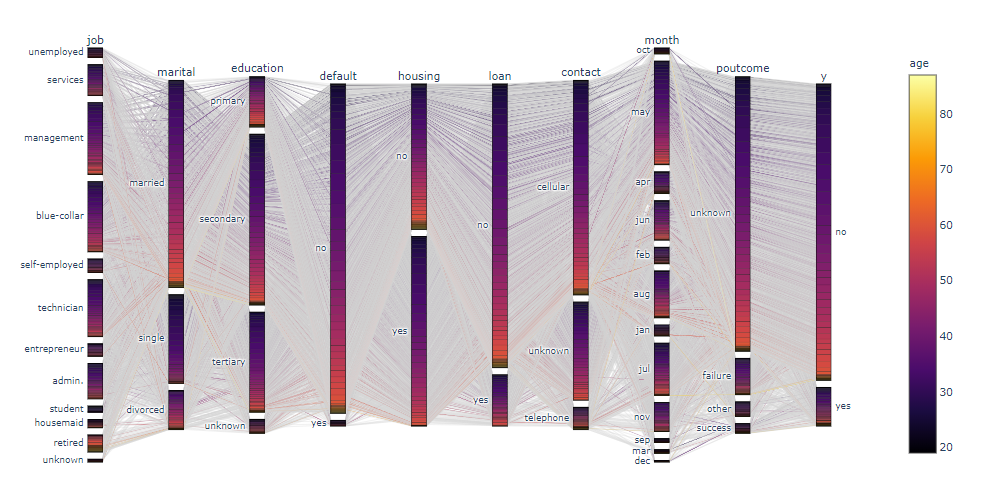
parallel_categories
특정 수치형 변수에 대해서 category 범주들의 시각화를 쉽게 해 줄 수 있다!!!
fig = px.parallel_categories(df, color="age",
                             color_continuous_scale=px.colors.sequential.Inferno)
fig.show()

parallel_coordinates
특정 범주형 변수에 대해서 numeric 변수들의 시각화를 쉽게 해 준다!
df["job_id"] = df["job"].astype("category").cat.codes
fig = px.parallel_coordinates(df, color="job_id",
                              color_continuous_scale=px.colors.diverging.Tealrose,
                              color_continuous_midpoint=2)
fig.show()
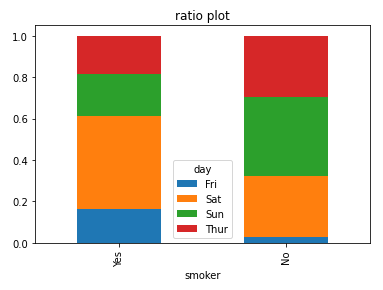
## Ratio Plot
import matplotlib.pyplot as plt
def ratio_plot_by_group(data , value , group = None,  fig_kws={"stacked" : True, "title" : ""}) :
    if group is None :
        result = data[value].value_counts(normalize=True)
        multi_index = pd.MultiIndex.from_product([[value], result.index.unique().tolist()],
                                         names=["group", value])
        result.index = multi_index
        result = result.unstack()
    else :
        result = data.groupby(group)[value].value_counts(normalize=True).unstack()
    result.plot(kind="bar",
                stacked= fig_kws.get("stacked" , True),
                title=fig_kws.get("title",""))
    plt.show()
    return None
ratio_plot_by_group(tips ,"day", group=None,fig_kws = {"stacked":True,"title" : "ratio plot"})
ratio_plot_by_group(tips ,"day", group="smoker",fig_kws = {"stacked":True,"title" : "ratio plot"})
ratio_plot_by_group(tips ,"day", group=["smoker","sex"],fig_kws = {"stacked":True,"title" : "ratio plot"})
## Seaborn Customizing OPTIONS
g = sns.catplot(x="total_bill", y="day", hue="time",
                height=3.5, aspect=1.5,
                kind="box", legend=False, data=tips);
g.add_legend(title="Meal")
g.set_axis_labels("Total bill ($)", "")
g.set(xlim=(0, 60),
      yticklabels=["Thursday", "Friday", "Saturday", "Sunday"])
g.despine(trim=True)
g.fig.set_size_inches(6.5, 3.5)
g.ax.set_xticks([5, 15, 25, 35, 45, 55], minor=True);
plt.setp(g.ax.get_yticklabels(), rotation=30);
def corr_vis(corr) :
    mask = np.zeros_like(corr)
    mask[np.triu_indices_from(mask)] = True
    with sns.axes_style("white"):
        f, ax = plt.subplots(figsize=(7, 5))
        g = sns.heatmap(corr, mask=mask, vmax=.3, square=True)
        g.set_xticklabels(g.get_xticklabels(), rotation = 30, fontsize = 10)
from sklearn.datasets import load_iris , load_boston
x = make_df(load_boston())
x_num = x.select_dtypes(include=[np.float64])
x_num_corr = x_num.corr()
corr_vis(x_num_corr)
https://plot.ly/python/plotly-express/
Plotly Express
Plotly Express is a terse, consistent, high-level API for rapid data exploration and figure generation.
plot.ly
'분석 Python > Visualization' 카테고리의 다른 글
| [ Python ] (범례 순서 변경) change legend order (0) | 2020.02.06 |
|---|---|
| [ Python ] density plot과 count ratio plot 그리기 (0) | 2020.02.01 |
| [ Python ] 시각화 여러 개의 그래프 형태 - 1 (0) | 2020.01.12 |
| [ Python ] 이미지들을 동영상으로 만들기 (images -> mp4) (0) | 2020.01.11 |
| [Python] tqdm nested progress bar 해보기 (0) | 2020.01.04 |