시각화 도구에 대해서 여러 가지 많이 시도해보는 것이 좋을 것 같아 정리를 하나씩 해보고자 한다.
이번 글에서는 시각화 기법중에서 많은 계층 구조 데이터를 표현할 때 적합한 treemap에 대해서 소개하고자 한다.
treemap이라는 시각화 기법은 Ben Shneiderman(American computer scientist and professor at the University of Maryland)에 의해서 1990년도에 처음 사용되어졌다
시각화의 공간은 양적 변수에 의해 크기와 순서가 정해지는 사각형으로 분할된다.
트리 맵의 계층에서 수준은 다른 사각형을 포함하는 사각형으로 시각화된다.
계층에서 동일한 수준에 속하는 각 사각형 집합은 데이터 테이블의 표현식 또는 컬럼을 나타난다.
계층에서 동일한 수준에 속하는 각각의 개별 사각형은 컬럼의 범주를 나타냅니다.
tree map의 적절한 사용 경우는 다음과 같다.
- 많은 범주 간의 부분-전체 관계를 시각화하고자 할 때
- 범주 간의 정확한 비교는 중요하지 않고 큰 특징만 보고자 할 때
- 데이터는 계층을 이루고 있을 때
필요한 라이브러리
import matplotlib.pyplot as plt
import squarify # pip install squarify
import pandas as pd
squarify
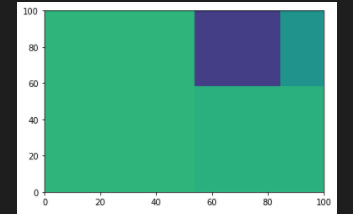
아주 간단하게 해당 계층에 크기(개수)만 알고 있으면 treemap을 그릴 수 있게 된다.
sizes = [50, 25, 12, 6]
squarify.plot(sizes)
plt.show()
이제 크기는 대충 알게 되니 각 사각형에 이름을 부여해보자.
간단하게 label을 추가해주면 된다.
sizes=[50, 25, 12, 6]
label=["50", "25", "12", "6"]
squarify.plot(sizes=sizes, label=label, alpha=0.6 )
plt.axis('off')
plt.show()
만약 랜덤 색깔이 아니라 고정된 color를 부여하고 싶다면 어떻게 할까?
sizes=[50, 25, 12, 6]
label=["50", "25", "12", "6"]
color=['red','blue','green','grey']
squarify.plot(sizes=sizes, label=label, color=color, alpha=0.6 )
plt.axis('off')
plt.show()

sizes=[50, 25, 12, 6]
label=["BC 1", "OT 1", "OT 2", "OT 3"]
color=['red','#1C9FB0','#32A0CE','#1C51B0']
squarify.plot(sizes=sizes, label=label, color=color, alpha=0.6 )
plt.axis('off')
plt.show()
Toy Example
실제 간단한 구조화된 데이터에서 진행을 해보자.
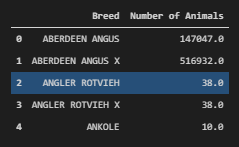
아래 데이터를 보면 종자 관련 수량이 적혀있는 데이터이다.
url = "https://s3-eu-west-1.amazonaws.com/data.defra.gov.uk/AnimalWelfare/animal-population-by-breed-on_1-march-2010.csv"
df = pd.read_csv(url)
df['Number of Animals'] = pd.to_numeric(df['Number of Animals'], errors='coerce')
df.dropna(inplace=True)
df.head()
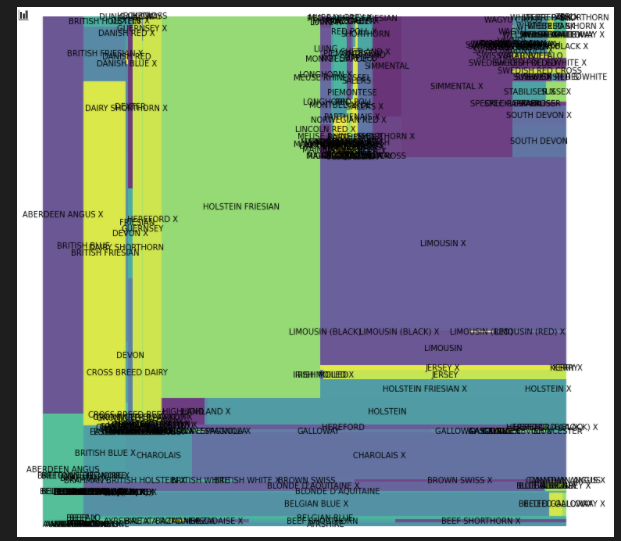
우리가 위에서 배운 함수를 이용해서 시각화해보자
fig, ax = plt.subplots(1, figsize = (12,12))
squarify.plot(sizes=df['Number of Animals'],
              label=df['Breed'],
              alpha=.8 )
plt.axis('off')
plt.show()
음 근데 실제로 라벨이 많고 사각형이 뒤죽박죽이라 그런지 지저분해서 잘 안 보이게 된다.
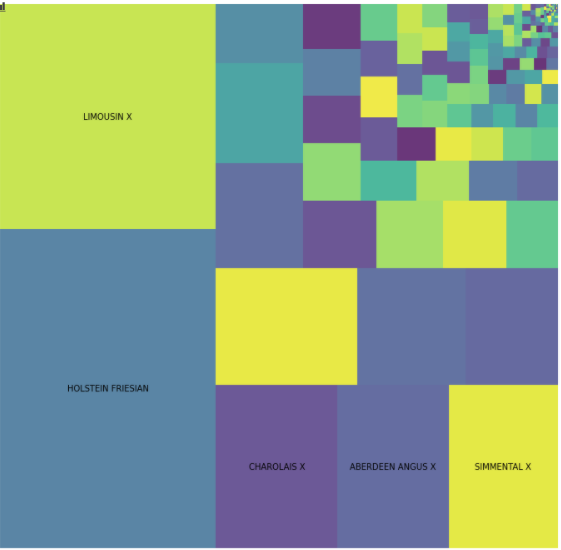
이제 그러면 정렬과 핵심적인 것만 보는 것을 해보자.
df.sort_values('Number of Animals', ascending=False, inplace=True)
fig, ax = plt.subplots(1, figsize = (12,12))
squarify.plot(sizes=df['Number of Animals'],
              label=df['Breed'][:5],
              alpha=.8 )
plt.axis('off')
plt.show()
plotly
data : www.kaggle.com/gregorut/videogamesales
df = pd.read_csv('vgsales.csv')
df.dropna(inplace=True)
df
plotly에서 treemap이라는 것을 사용하는데,
아주 쉽게 계층을 여러 개를 지정하고 특정 컬럼 value로 하여 시각화할 수 있다!!
import plotly.express as px
fig = px.treemap(df,
                 path=['Platform', 'Genre'],
                 values='Global_Sales',
                 color='NA_Sales'
                )
fig.show()
import plotly.express as px
df = px.data.tips()
fig = px.treemap(df, path=['day', 'time', 'sex'], values='total_bill')
fig.show()
안에 있는 total_bill은 해당 그룹의 sum값을 의미한다.
그리고 해당 구역의 크기는 count를 기반으로 하는 것 같다.
그렇게 생각한 이유는 실제로 계산을 한 결과를 데이터 넣었을 때와 위의 결과의 형태가 일치해서다.
count = df.groupby(['day', 'time', 'sex']).agg("count")["total_bill"].reset_index(drop=False)
fig = px.treemap(count, path=['day', 'time', 'sex'], values='total_bill')
fig.show()

아래 코드가 거의 끝판왕 코드인 것 같다.
import plotly.graph_objects as go
from plotly.subplots import make_subplots

import pandas as pd

df1 = pd.read_csv('https://raw.githubusercontent.com/plotly/datasets/718417069ead87650b90472464c7565dc8c2cb1c/sunburst-coffee-flavors-complete.csv')
df2 = pd.read_csv('https://raw.githubusercontent.com/plotly/datasets/718417069ead87650b90472464c7565dc8c2cb1c/coffee-flavors.csv')

fig = make_subplots(
    rows = 1, cols = 2,
    column_widths = [0.4, 0.4],
    specs = [[{'type': 'treemap', 'rowspan': 1}, {'type': 'treemap'}]]
)

fig.add_trace(
    go.Treemap(
        ids = df1.ids,
        labels = df1.labels,
        parents = df1.parents),
    col = 1, row = 1)

fig.add_trace(
    go.Treemap(
        ids = df2.ids,
        labels = df2.labels,
        parents = df2.parents,
        maxdepth = 3),
    col = 2, row = 1)

fig.update_layout(
    margin = {'t':0, 'l':0, 'r':0, 'b':0}
)

fig.show()
plotly에 아주 많은 예시들이 있는데 참고하면 도움이 될 것 같다.
Treemap Charts
How to make Treemap Charts with Plotly
plotly.com
'분석 Python > Visualization' 카테고리의 다른 글
| pybaobabdt) DT Tree Visualization 해보기 (0) | 2021.12.18 |
|---|---|
| python) histogram 알아보기 (0) | 2021.05.01 |
| [Visualization] Learning Curve를 이용하여 시각화하기(Train/Valid) (0) | 2020.12.18 |
| [Visualization] keras 결과물(history) 시각화하는 함수 (0) | 2020.11.21 |
| [Visualization] x 축에 있는 margin 제거하기 (2/2) (0) | 2020.11.19 |