728x90

광고 한번만 눌러주세요 ㅎㅎ 블로그 운영에 큰 힘이 됩니다.
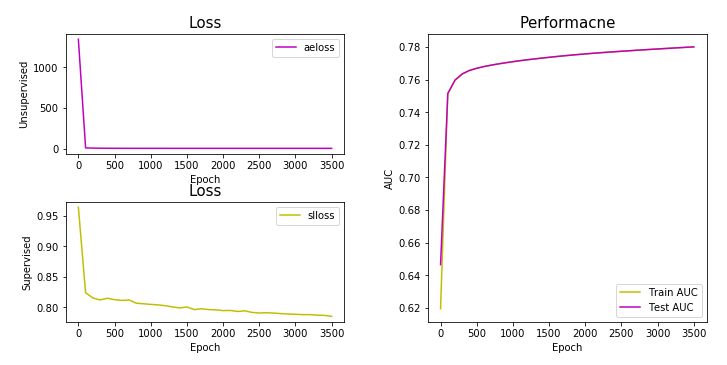
여러가지 그림을 한꺼번에 표현하고 싶을 때, 각각의 그림에 대해서 그림을 그리고, 이름을 부여고하고, y축 x축 변경해줘야 할 것이 많다.
하지만 이런 것을 반복하다보면, 코드가 너무 장황해지고 길어지는 것을 경험하였다.
그래서 이런 것을 보다 그림을 표현할 때는 간단하게 하고 싶기 때문에, 만들어봤다.
유용하다 생각하시면, 더 업그레이드 하셔서 블로그나 깃헙 같은 곳에 공유해주세요 :)
import numpy as np , pickle
import matplotlib.pyplot as plt
with open("./../02/resut.pkl", "rb") as rb :
    result = pickle.load(rb)
def subplotting(ax , store , x , y ,cond={}, **kwargs) :
ax.plot(store[x],store[y],**kwargs)
if "ylabel" in cond :
ax.set_ylabel(cond["ylabel"], fontsize= 10)
if "xlabel" in cond :
ax.set_xlabel(cond["xlabel"], fontsize= 10)
if "xlim" in cond :
ax.set_xlim(cond["xlim"])
if "ylim" in cond :
ax.set_ylim(cond["ylim"])
if "title" in cond :
ax.set_title(cond["title"], fontsize= 15)
ax.legend()
return axfig = plt.figure(figsize=(10, 5))
plt.subplots_adjust(left=0.1, bottom=0.1, right=0.99,
top=0.9, wspace=0.3, hspace=0.4)
gs = GridSpec(nrows=2, ncols=2)
ax = fig.add_subplot(gs[0,0])
kwarg = {"label" : "aeloss", "color": "m"}
cond = {"xlabel": "Epoch", "ylabel" : "Unsupervised",
"title" : "Loss"}
subplotting(ax , result , "epoch" , "aeloss" , cond, **kwarg ) # ,**kwargs
ax1 = fig.add_subplot(gs[1,0])
kwarg = {"label" : "slloss", "color": "y"}
cond = { "xlabel": "Epoch", "ylabel" : "Supervised",
"title" : "Loss"}
subplotting(ax1 ,result , "epoch" , "slloss" , cond, **kwarg ) # ,**kwargs
ax2 = fig.add_subplot(gs[:,1])
kwarg = {"label" : "Train AUC", "color": "y"}
cond = {"xlabel": "Epoch", "ylabel" : "AUC",
"title" : "Performacne"}
subplotting(ax2 ,result , "epoch" , "auc", cond, **kwarg ) # ,**kwargs
kwarg = {"label" : "Test AUC", "color": "m"}
cond = {}
subplotting(ax2 ,result , "epoch" , "teauc", cond, **kwarg ) # ,**kwargs
plt.show()
https://github.com/sungreong/Blog/blob/master/%5B0329%5DSubplots%20Custom%20plotting.ipynb
'분석 Python > Visualization' 카테고리의 다른 글
| subplot zip을 사용해서 쉽게 나열해서 시각화하기 (seaborn boxplot) (0) | 2020.04.08 |
|---|---|
| Matplotlib 한글폰트 사용하는 전체 또는 개별 적용하는 방법 (0) | 2020.04.03 |
| 파이썬 subplots 좀 더 잘 사용해보기 (0) | 2020.03.29 |
| [ Python ] (범례 순서 변경) change legend order (0) | 2020.02.06 |
| [ Python ] density plot과 count ratio plot 그리기 (0) | 2020.02.01 |