728x90

광고 한번만 눌러주세요 블로그를 운영하는데 있어서 동기부여가 됩니다.:)
모델링하다 보면 변수가 너무 많아서 무엇을 뽑을지 모를 때가 있다.
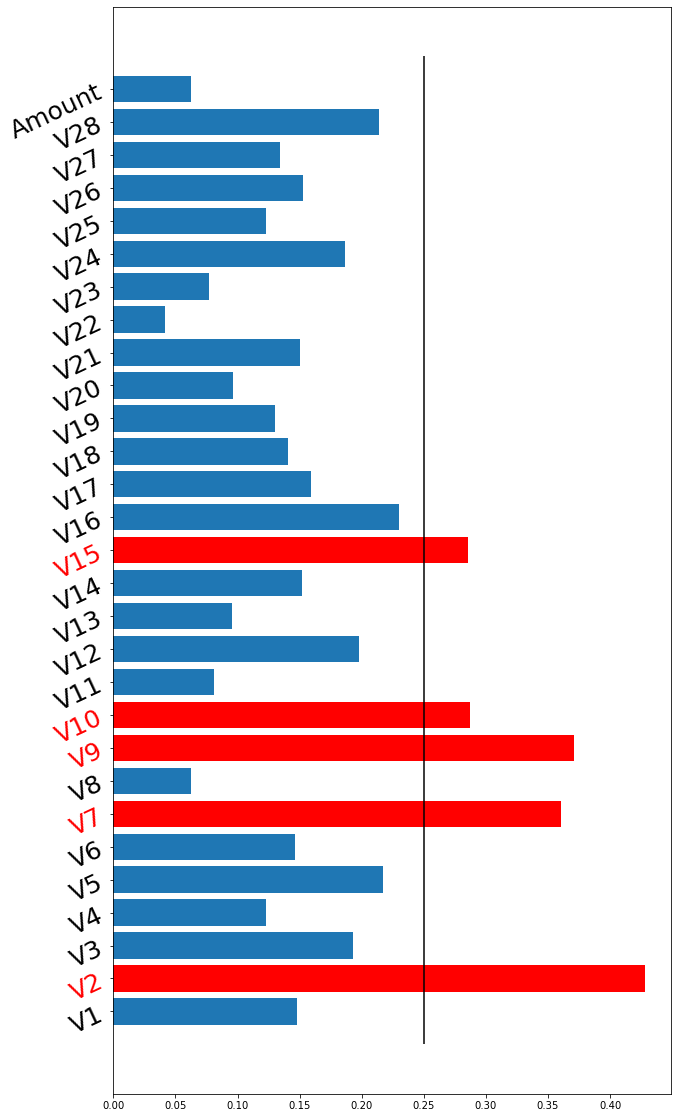
이럴 때 간단히 할 수 있는 방법은 칼럼 별 분포를 타깃별로 보고 분포가 차이가 얼마나 나는 지 확인 후 선택하는 방법이 있다.
여기서 한 것은 분포간 거리를 재는 divergence 중에서 wasserstein distance를 사용해서 해봤다.
특정 threshold를 부여하여 그것보다 차이가 날 경우 뽑는 방식으로 선택했다.
그리고 분포간 스케일이 다를 수 있기 때문에 min-max 함수를 통해 (-1,1)로 통일하였다.
실제 여기서 좀 문제가 되는 점이라고 할 수 있는 점은 스케일링을 어떻게 하는지에 따라서 distance가 다르게 나왔다.
import numpy as np
import matplotlib.pyplot as plt
from scipy.stats import wasserstein_distance as wd


target = data.pop("Class")
data = data.fillna(data.mean())

idx1 = data.Class == 1
idx0 = data.Class == 0
cols = {}
for col in data.columns.tolist() :
    target1 = data.loc[idx1 , [col]].dropna()
    target0 = data.loc[idx0 , [col]].dropna()
    m = MinMaxScaler(feature_range=(0,1))
    target1 = m.fit_transform(target1)
    target0 = m.fit_transform(target0)
    dist = wd(np.squeeze(target1) , np.squeeze(target0))
    cols[col] = dist

name = list(cols.keys())
dist = np.array(list(cols.values()))

fig, axes = plt.subplots( 1,1, figsize=(10,20))
pos = np.arange(len(dist))
bars = plt.barh( pos , np.squeeze(dist))
plt.yticks(pos , name)
threshold = 0.4
importance_var = []
for idx , tick in enumerate( axes.yaxis.get_major_ticks()) :
    tick.label.set_fontsize(25)
    tick.label.set_rotation(25)
    if tick.label.get_text() in ["C" , "D"] :
        tick.label.set_color("green")
    if np.squeeze(dist)[idx] > threshold :
        tick.label.set_color("red")
        importance_var.append(name[idx])
        bars[idx].set_facecolor("red")
plt.vlines(x=threshold , ymin =-1 , ymax= len(dist))
plt.show()
print("중요 변수 : ",importance_var)
뽑힌 중요 변수를 시각화하면 다음과 같다.
import seaborn as  sns
important =  ['V2', 'V5', 'V7', 'V9', 'V10', 'V15', 'V16', 'V28']
fig , axes = plt.subplots(nrows=4 ,ncols=2, figsize=(10,10) )
plt.subplots_adjust(left=None, bottom=None, right=None,
                    top=None, wspace=None, hspace=0.5)
ax = axes.flatten()
for idx , col in enumerate(important) :
    target1 = data.loc[idx1 , [col]].dropna()
    target0 = data.loc[idx0 , [col]].dropna()
    m = MinMaxScaler(feature_range=(-1,1))
    target1 = m.fit_transform(target1)
    target0 = m.fit_transform(target0)
    dist = wd(np.squeeze(target1) , np.squeeze(target0))
    msg = "[{}] {}".format(col , dist)
    sns.distplot(target1 , ax = ax[idx])
    sns.distplot(target0 , ax = ax[idx])
    ax[idx].set_title(msg , fontsize=  15)
plt.show()
그렇다면 여기서 새로운 파생변수를 만들어보자.
일단 우리는 이 변수에 대해서 정확히 먼지 모르기 때문에 가장 쉬운 사칙 연산을 통해 만들어보자.
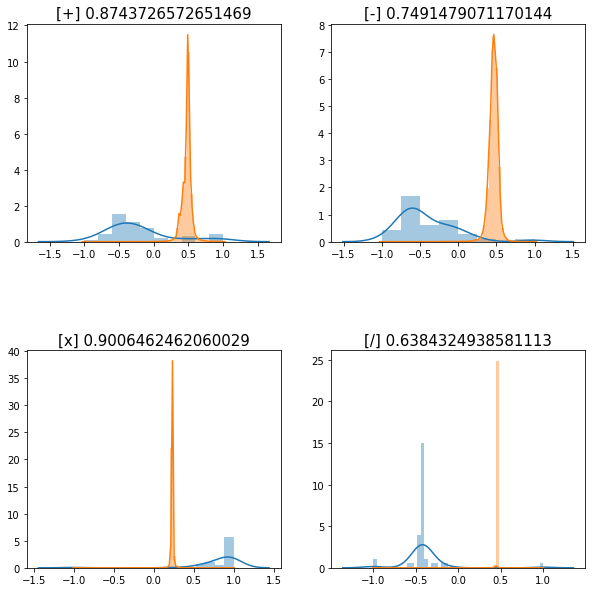
여기서는 V2 , V9를 이용해서 + , - , x , / 총 4가지를 시각화해보겠다.
newcol = ["+" , "-" , "x", "/"]
fig , axes = plt.subplots(nrows=2 ,ncols=2, figsize=(10,10) )
plt.subplots_adjust(left=None, bottom=None, right=None,
                    top=None, wspace=None, hspace=0.5)
ax = axes.flatten()

for idx , col in enumerate(newcol) :
    if col == "+" :
        data[col] = (data.loc[: , "V2"] + data.loc[: , "V9"])
    elif col == "/" :
        data[col] = (data.loc[: , "V2"] / data.loc[: , "V9"])
    elif col == "-" :
        data[col] = (data.loc[: , "V2"] - data.loc[: , "V9"])
    elif col == "x" :
        data[col] = (data.loc[: , "V2"] * data.loc[: , "V9"])
    target1 = data.loc[idx1 , [col]].dropna()
    target0 = data.loc[idx0 , [col]].dropna()
    m = MinMaxScaler(feature_range=(-1,1))
    target1 = m.fit_transform(target1)
    target0 = m.fit_transform(target0)
    sns.distplot(target1 , ax = ax[idx])
    sns.distplot(target0 , ax = ax[idx])
    msg = "[{}] {}".format(col , dist)
    ax[idx].set_title(msg , fontsize=  15)
    dist = wd(np.squeeze(target1) , np.squeeze(target0))
plt.show()
위의 결과롤 보면 알겠지만, distance가 무려 0.9라는 수치로 나오게 하는 파생변수를 만들게 되었다.
실제 이 변수를 사용하게 된다면, 좀 더 분류를 하는데 있어서 도움이 될 수 있을 것이다.
-끝-
'분석 Python > Data Preprocessing' 카테고리의 다른 글
| [변수 선택] sklearn에 있는 mutual_info_classif , mutual_info_regression를 활용하여 변수 선택하기 (feature selection) (0) | 2020.03.09 |
|---|---|
| [변수 선택 및 생성]중요 변수 선택 및 파생 변수 만들기-2 (0) | 2020.01.09 |
| [ Python ] Scikit-Learn, 변수 전처리 Pipeline Transformer 만들어보기 (0) | 2019.12.28 |
| [ 변수 처리] 결측치 대체 알고리즘 MissForest Imputation 연습 (0) | 2019.12.11 |
| [변수 처리] 데이터에서 결측치 잘 만들어보기 (0) | 2019.09.17 |