728x90
import seaborn as sns
fig , axes = plt.subplots(1,2)
axx = axes.flatten()
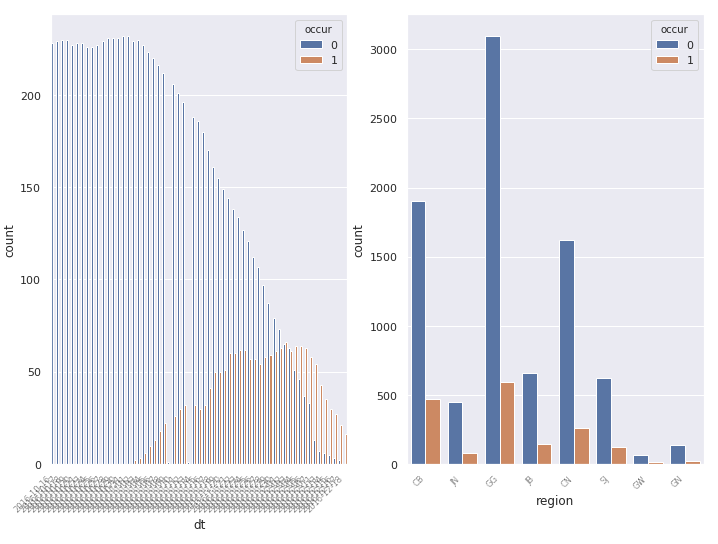
g = sns.countplot(x="dt", data=tmp , hue = "occur" , ax = axx[0] ,)
g.set_xticklabels(g.get_xticklabels(), rotation=45,
                  horizontalalignment='right',
                  fontweight='light',
                  fontsize='x-small'
                 )
g = sns.countplot(x="region", data=tmp , hue = "occur" , ax = axx[1])
g.set_xticklabels(g.get_xticklabels(), rotation=45,
                  horizontalalignment='right',
                  fontweight='light',
                  fontsize='x-small'
                 )
plt.show()
https://www.drawingfromdata.com/how-to-rotate-axis-labels-in-seaborn-and-matplotlib
How to rotate axis labels in seaborn and matplotlib — Drawing from Data
There's a common pattern which often occurs when working with charting libraries: drawing charts with all the defaults seems very straightforward, but when we want to change some aspect of the chart things get complicated. This pattern is even more noticab
www.drawingfromdata.com
'분석 Python > Visualization' 카테고리의 다른 글
| [ Python ] 신뢰구간 시각화하기 (lineplot or fill_between) (0) | 2019.10.31 |
|---|---|
| [ Python ] plotly express facet_row , col scale free 하는 법 공유 (0) | 2019.10.18 |
| 파이썬에서 R처럼 gather 함수와 자주 쓸 것 같은 시각화 코드 (0) | 2019.07.06 |
| Python Group 별로 Bar Graph 그릴 때, (0) | 2019.06.09 |
| Python에서 RocCurve 시각화하기. (0) | 2019.05.18 |