도움이 되셨다면, 광고 한번만 눌러주세요. 블로그 관리에 큰 힘이 됩니다 ^^
우리 데이터는 많은데, 희귀 케이스는 적을 때 딥러닝 방법을 쓰고 싶을 때,
AutoEncoder를 사용해서 희귀한 것에 대해서 탐지하는 방법론으로 대체한다고 한다.
이런 방법론을 써야지 노말한 데이터를 다 사용할 수 있으니 말이다.
이제는 만약에 내가 가진 데이터가 시계열성을 가진 데이터면 어떻게 해야 할까??
기존 방식을 사용하게 되면 시간적인 변수를 고려하지 못하게 된다.
그러므로 이번에는 시간 부분도 고려해서 향상한 모델인 LSTM AutoEncoder 방법을 사용해보자.
1. 일단 LSTM을 위한 데이터 정제
2. 모델링
3. 희귀 케이스 어떻게 잡는지?
일단 LSTM이 뭘까?
LSTM은 RNN의 일종으로써 , 타임 시계열적인 데이터를 적용할 때 주로 사용하고
RNN의 짧은 기억을 보완하는 알고리즘이다.

마찬가지로 Normal 데이터만으로 학습시키고,
만약 먼가 이상하게 높은 수치가 나오면 그놈은 이상한 놈이라고 할 거라는 것 같다.
LSTM으로 구성하려면 특별한 형태로 데이터를 정제해야 한다.

LSTM으로 쓰려면 3차원 형태로 변경시켜줘야 한다. 주의해서 보라고 한다.
Curve Shifting
일단 목적은 발생하기 전에 일어날 조짐을 예측하는 것이 이번 LSTM 구조의 목적이다
그래서 여기선 4분 전에 예측하려고 한다.
df.y=df.y.shift(-2) 이런 식으로 shift를 사용한다고 한다.
머 여기선 n을 1로 잡아서, 4분 뒤로 예측하는 식으로 하고, 그다음에 n을 제거한다.
이유는 발생을 예측하는 것이 아니라 발생하기 전 조짐을 예측하는 것이기 때문이다.(흥미롭지만 흐음)
(사실 이해 못했다) 흑 ㅠ
sign = lambda x: (1, -1)[x < 0]

def curve_shift(df, shift_by):
    '''
    This function will shift the binary labels in a dataframe.
    The curve shift will be with respect to the 1s.
    For example, if shift is -2, the following process
    will happen: if row n is labeled as 1, then
    - Make row (n+shift_by):(n+shift_by-1) = 1.
    - Remove row n.
    i.e. the labels will be shifted up to 2 rows up.

    Inputs:
    df       A pandas dataframe with a binary labeled column.
             This labeled column should be named as 'y'.
    shift_by An integer denoting the number of rows to shift.

    Output
    df       A dataframe with the binary labels shifted by shift.
    '''

    vector = df['y'].copy()
    for s in range(abs(shift_by)):
        tmp = vector.shift(sign(shift_by))
        tmp = tmp.fillna(0)
        vector += tmp
    labelcol = 'y'
    # Add vector to the df
    df.insert(loc=0, column=labelcol+'tmp', value=vector)
    # Remove the rows with labelcol == 1.
    df = df.drop(df[df[labelcol] == 1].index)
    # Drop labelcol and rename the tmp col as labelcol
    df = df.drop(labelcol, axis=1)
    df = df.rename(columns={labelcol+'tmp': labelcol})
    # Make the labelcol binary
    df.loc[df[labelcol] > 0, labelcol] = 1

    return df

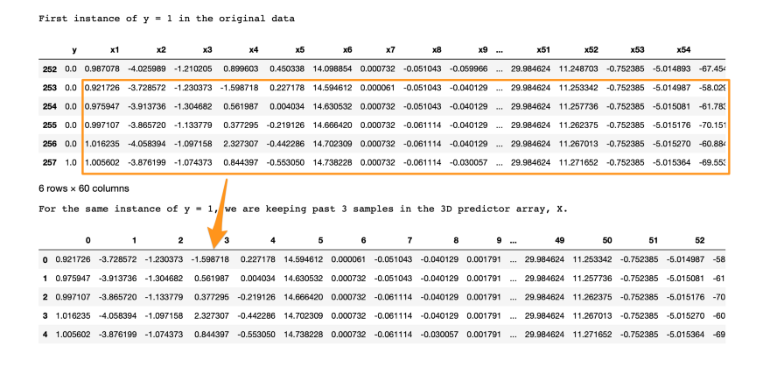
요런 식이 결과인데, 으음 보면 8:38분 발생이니깐 ,
그 2분 전 , 4분 전 놈들을 1이라고 만들고 8:38분은 없애가지고 적 사전 예측 개념으로 만드는 것 같다.
즉 이렇게 하는 이유는, 먼가 사전에 조짐이 있을 거라는 가정이 있다.
최근에도 이런 식으로 사전 예측 개념을 써서 하는 게 있는데,
실제로 여기서 보니까, 역시... 그분은 직관이 굉장히 훌륭하신 분이라는 것을 다시 깨닫는다.
이제 LSTM 형태로 만들기 위해서 3D array로 만들어줘야 한다!
구조는 다음과 같이 한다고 한다. sample x lookback x features!!
sample : 관측치 수 , 즉 데이터 개수
lookback : LSTM model에서 과거 어디까지 볼 것인지에 대한 것이다.
features : 현재 인풋으로 사용할 개수
input_X = df.loc[:, df.columns != 'y'].values  # converts the df to a numpy array
input_y = df['y'].values
n_features = input_X.shape[1]  # number of features
현재 여기까지 하게 되면 Input은 2D다. 즉 sample x features 이제 여기다가 Lookback을 추가해야 한다.
def temporalize(X, y, lookback):
    X = []
    y = []
    for i in range(len(input_X)-lookback-1):
        t = []
        for j in range(1,lookback+1):
            # Gather past records upto the lookback period
            t.append(input_X[[(i+j+1)], :])
        X.append(t)
        y.append(input_y[i+lookback+1])
    return X, y

그래서 저 lookback을 5로 해서 저가 어디까지 볼지를 정하게 된 거다!
Standardize the Data
항상 개인적으로 표준화를 할까 말까 고민하는데, 이 저자는 하는 게 좋다고 한다.
흔히 표준화할 때 하는 실수는 두 개를 분리하기 전에 전체 데이터에서 normalize를 하는 것이다.
이것은 굉장히 큰 실수다. 왜냐면 test data의 가정은 우리가 한 번도 보지 못한 데이터이기 때문이다.
그러므로 다음과 같이 해야 한다.
전체 데이터 -> Train , Test -> Train 표준화 -> Test는 Train의 평균과 잔차 값을 활용하여서 Standardize
또 주의할 점!
여기서 저자는 2D에서 Normalize를 안 해주고, 3D에서 해준다.
만약 2D에서 Normalize를 해준 것은 3D test에 하면 결국 위치 정보를 읽어버려서 유효한 검사를 할 수 없게 된다.
모델링은 원 코드 참고
valid_x_predictions = lstm_autoencoder.predict(X_valid_scaled)
mse = np.mean(np.power(flatten(X_valid_scaled) - flatten(valid_x_predictions), 2), axis=1)
error_df = pd.DataFrame({'Reconstruction_error': mse,
                        'True_class': y_valid.tolist()})
precision_rt, recall_rt, threshold_rt = precision_recall_curve(error_df.True_class, error_df.Reconstruction_error)
plt.plot(threshold_rt, precision_rt[1:], label="Precision",linewidth=5)
plt.plot(threshold_rt, recall_rt[1:], label="Recall",linewidth=5)
plt.title('Precision and recall for different threshold values')
plt.xlabel('Threshold')
plt.ylabel('Precision/Recall')
plt.legend()
plt.show()


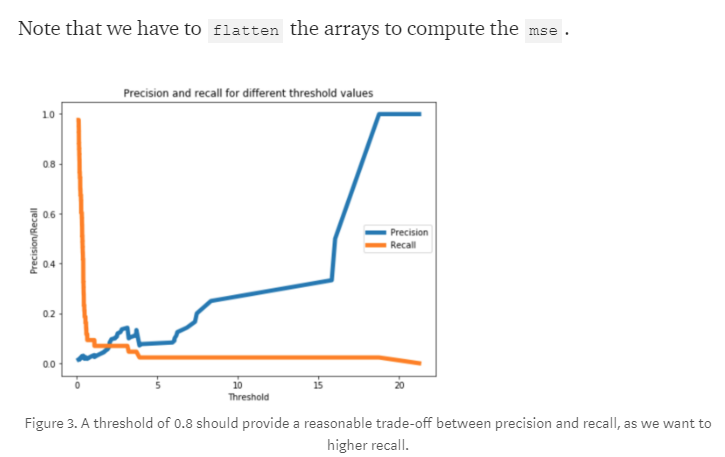
저자의 결과다 으음 나는 먼가 확확 튀게 나올 것을 기대했는데, 실제로 그러기에는 굉장히 어려운 것 같다.
하지만 저자는 10% 향상을 해서 좋아한다. 그만큼 어려운 주제여서 그런 것인가?
모델 향상하는 법
- CNN LSTM AE
- Dropout Layer
- Gaussian-dropout Layer
- SELU
- alpha_dropout with SELU
다음 포스터에서는 이 LSTM을 향상한다고 하니, 기대가 된다.
원글
Extreme Rare Event Classification using Autoencoders in Keras
In this post, we will learn how to implement an autoencoder for building a rare-event classifier. We will use a real-world rare event…
towardsdatascience.com
https://towardsdatascience.com/extreme-event-forecasting-with-lstm-autoencoders-297492485037
towardsdatascience.com
github.com
'관심있는 주제' 카테고리의 다른 글
| UMAP이 T-SNE와 다른점에 대한 글 리뷰 (3) | 2019.10.05 |
|---|---|
| Scipy에서 제공하는 분포간 거리 함수(Statistical Distance)와 차이점. (2) | 2019.06.08 |
| Uncertainty Autoencoders: Learning Compressed Representations via Variational Information Maximization - 리뷰 (0) | 2019.06.05 |
| 머신러닝 모델 학습시키기전에 마인드부터 어떻게 해야할지? (0) | 2019.05.18 |
| Anomaly Detection Using VAE (2) | 2019.05.11 |