고객 생애 가치를 예측할 때는 기존 회귀 모델 방식보다는 다른 특정 가정을 사용하고 있는 모델을 사용해야 한다.
lifetimes이라는 패키지를 사용하는 예시를 해보고자 한다.
고객 생애 가치(CLV)는 고객이 인수부터 비즈니스와의 관계가 종료될 때까지 지출할 총금액입니다.
참고 부탁드립니다.
2022.03.17 - [분석 Python/구현 및 자료] - Python) 고객 생애 가치(CLV)에 대해서 알아보기
예측(Prediction)과 Calculation(계산)에 차이는 무엇일까요?
CLV를 계산할 때, 오로지 현재 상황을 조사하고 분석만 할 수 있습니다.
그래서 우리는 고객에 새로운 상품을 살 때나 특정한 한계에 도달했을 때 추측할 수가 없습니다.
예측을 통해 우리는 기계 학습을 프로세스에 추가하고 고객의 이탈 프로세스를 예측할 수 있습니다.
모든 고객에게는 특별한 이탈률이 있으며 머신 러닝을 사용할 수 있습니다.
Implementation
1. 패키지 설치
pip install lifetimes
pip install sqlalchemy
2. 데이터 준비
데이터는 아래 링크의 데이터를 사용했다.
https://archive.ics.uci.edu/ml/datasets/Online+Retail+II
from sqlalchemy import create_engine
import datetime as dt
import pandas as pd
import matplotlib.pyplot as plt
from lifetimes import BetaGeoFitter
from lifetimes import GammaGammaFitter
from lifetimes.plotting import plot_period_transactions
def outlier_thresholds(dataframe, variable):
 quartile1 = dataframe[variable].quantile(0.01)
 quartile3 = dataframe[variable].quantile(0.99)
 interquantile_range = quartile3 — quartile1
 up_limit = quartile3 + 1.5 * interquantile_range
 low_limit = quartile1–1.5 * interquantile_range
 return low_limit, up_limit
def replace_with_thresholds(dataframe, variable):
    low_limit, up_limit = outlier_thresholds(dataframe, variable)
    dataframe.loc[(dataframe[variable] < low_limit), variable] = low_limit
    dataframe.loc[(dataframe[variable] > up_limit), variable] = up_limit
# Additional info; 'outlier_thresholds' function, is so useful function you can use it in your data preparation process, it finds out outlier_thresholds and equals it either up_limit or low_limit. They are simultaneously used with replace_with_thresholds function. With the help of these two function, We will equalize our outlier thresholds to determined low_limit and up_limit values without taking a long time.
#Where you can find the dataset https://archive.ics.uci.edu/ml/datasets/Online+Retail+II
df_ = pd.read_excel(“online_retail_II.xlsx”,
 sheet_name=”Year 2010–2011")
df = df_.copy()

df.describe().T
df.dropna(inplace=True)
#For focusing on CLV prediction ,I fastly deleted all missing values.
df = df[~df["Invoice"].str.contains("C", na=False)]
# removing Cancellations from the data
replace_with_thresholds(df, "Quantity")
replace_with_thresholds(df, "Price")
#After our transactions, Let's check it out how describe looks like.
df.describe().T
df[“TotalPrice”] = df[“Quantity”] * df[“Price”]
고객 가치 분석에서는 RFM이라는 개념이 있다.
Recency - 고객의 최근성
Frequency - 고객의 구매빈도
Monetary - 고객의 구매금액
| Recency | Passed time since last purchase |
| Frequency | total number of repeat purchases |
| Monetary | average earnings per purchase |
| T | how long before the analysis date the first purchase was made [Weekly] 분석 날짜가 처음 구매되기까지 얼마나 오래 [주간] |
cltv_df = df.groupby(‘Customer ID’).agg({‘InvoiceDate’: [lambda date: (date.max() — date.min()).days,
 lambda date: (today_date — date.min()).days],
 ‘Invoice’: lambda num: num.nunique(),
 ‘TotalPrice’: lambda TotalPrice: TotalPrice.sum()})
cltv_df.columns = cltv_df.columns.droplevel(0)
cltv_df.columns = ['recency', 'T', 'frequency', 'monetary']
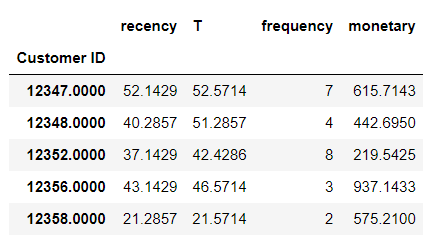
cltv_df.head(5)
여기서 RTFM 변수를 생성했지만, 적절한 데이터 포맷으로 변경시켜줄 필요가 있었습니다.
예를 들어; 화폐는 '평균 수입'이어야 하지만 고객의 총수입을 보여줍니다. 그래서 기본적인 파이썬 코드로 그것을 변형할 것입니다.
#Expressing "monetary value" as average earnings per purchase
cltv_df["monetary"] = cltv_df["monetary"] / cltv_df["frequency"]
# selection of monetary values greater than zero
cltv_df = cltv_df[cltv_df["monetary"] > 0]
# Expression of "recency "and "T" in weekly terms
cltv_df["recency"] = cltv_df["recency"] / 7
cltv_df["T"] = cltv_df["T"] / 7
#frequency must be greater than 1.
cltv_df = cltv_df[(cltv_df['frequency'] > 1)]
After all trasformation ,lets check how our data looks like now.
ctlv_df.head()
BG-NBD 모델에서 실행되도록 전체 데이터 세트를 구성했습니다.
3. Establishment of BG-NBD Model/Expected Sales Forecasting with BG-NBD Model
Beta-Geometric/Negative Binomial Distribution(BG/NBD) 모형,
BG/NBD 모형은 개별 고객의 이탈 확률은 기하 분포, 고객 간 이탈의 이질성은 베타 분포를 따른다고 가정하는 BG(Beta-Geometric mix) 모형을 사용하여 이탈 프로세스를 추정
생존기간 동안 개별 고객의 구매빈도는 포아송 분포, 고객 간 재구매 차이는 감마 분포를 가정하는 것이 특징
bgf = BetaGeoFitter(penalizer_coef=0.001)
#setting up the model
bgf.fit(cltv_df['frequency'],
        cltv_df['recency'],
        cltv_df['T'])
#fitting of all dataset
- Who are the 10 customers we expect the most to purchase in a week?
bgf.conditional_expected_number_of_purchases_up_to_time(1,
                                                        cltv_df['frequency'],
                                                        cltv_df['recency'],
                                                        cltv_df['T']).sort_values(ascending=False).head(10)
#1 = 1 week

cltv_df["expected_purc_1_week"] = bgf.predict(1,
                                              cltv_df['frequency'],
                                              cltv_df['recency'],
                                              cltv_df['T'])
#conditional_expected_number_of_purchases_up_to_time and predict are basically same.
cltv_df.head(5)
- Who are the 10 customers we expect the most to purchase in 1 month?
bgf.predict(4,
            cltv_df['frequency'],
            cltv_df['recency'],
            cltv_df['T']).sort_values(ascending=False).head(10)

cltv_df[“expected_purc_1_month”] = bgf.predict(4,
 cltv_df[‘frequency’],
 cltv_df[‘recency’],
 cltv_df[‘T’])
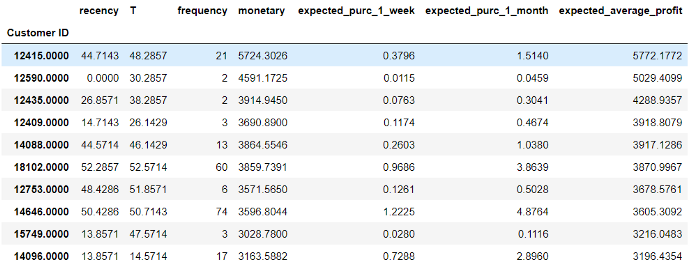
cltv_df.sort_values("expected_purc_1_month", ascending=False).head(10)
#Sorted the variables accourding to 1month expected purchase prediction.

- What is the Expected Number of Sales of the Whole Company in 1 Month?
bgf.predict(4,cltv_df['frequency'],cltv_df['recency'],cltv_df['T']).sum()
OUTPUT = 1777.1450731636987
#It is a transaction amount that is expected in the next month.
- Evaluation of Forecast Results
plot_period_transactions(bgf)
plt.show()
4. Establishing the GAMMA-GAMMA Model/Expected Average Profit with Gamma-Gamma Model
Normal/Normal 모형에서는 구매자의 구매 건 간 구매금액 차이와 고객 간 평균 구매금액 차이를 정규분포로 가정한다.
반면, Gamma/Gamma 모형은 Normal/Normal 모형에서의 왜곡 문제를 조정하기 위해 제안된 것으로, 구매자의 구매 건 간 구매금액 차이와 고객 간 평균 구매금액 차이 모두 감마 분포로 가정하는 것이 특징
frequency , monetary를 사용합니다.
ggf = GammaGammaFitter(penalizer_coef=0.01)
ggf.fit(cltv_df['frequency'], cltv_df['monetary'])
#As I mentioned above, we only use two variables . We used 3 variables on BG-NBD model.
ggf.conditional_expected_average_profit(cltv_df['frequency'],
                                       cltv_df['monetary']).head(10)
cltv_df["expected_average_profit"] = ggf.conditional_expected_average_profit(cltv_df['frequency'],                                                                cltv_df['monetary'])
cltv_df.head(10)
cltv_df["expected_average_profit"] = ggf.conditional_expected_average_profit(cltv_df['frequency'],                                                                cltv_df['monetary'])
cltv_df.sort_values("expected_average_profit",ascending=False).head(10)
#Sorted values according to expected_avarage_profit
5. Calculation of CLTV with BG-NBD and Gamma-Gamma Model
cltv = ggf.customer_lifetime_value(bgf,
 cltv_df['frequency'],
 cltv_df['recency'],
 cltv_df['T'],
 cltv_df['monetary'],
 time=3, # 3 Months
 freq='W', # Frequency of T ,in this case it is 'weekly'
 discount_rate=0.01)
cltv = cltv.reset_index()
cltv.head()
cltv_final = cltv_df.merge(cltv, on="Customer ID", how="left")
#merging our real dataset and cltv_df data.
cltv_final
scaler = MinMaxScaler(feature_range=(0, 1))
#score between 0-1 ,1 is best 0 is worst. You can change by your wish, if you want you can score between 0-100 .
scaler.fit(cltv_final[[“clv”]])
cltv_final[“scaled_clv”] = scaler.transform(cltv_final[[“clv”]])
cltv_final.sort_values(by="scaled_clv", ascending=False).head()6. Creating Segments by CLTV
# Let's divide the customers into 4 groups:
cltv_final["segment"] = pd.qcut(cltv_final["scaled_clv"], 4, labels=["D", "C", "B", "A"])
cltv_final.head()
cltv_final.sort_values(by="scaled_clv", ascending=False).head(10)

결론
CLV를 예측하는 모델들에 대해서 알아봤습니다.(GammaGammaFitter, BG-NBD Model)
CLV의 도움으로 고객을 세분화했고 이제 다양한 세그먼트에 대해 다양한 마케팅 전략을 생성할 수 있습니다.
이러한 방식으로 마케팅 예산을 보다 효율적으로 사용할 수 있다고 합니다.
여기서는 간단한 CLV를 알아봤지만, 실제로 이것을 정의하는 것은 굉장히 어려울 수도 있다는 생각이 들었습니다.
실제로 도메인에 따라서 다르게 계산하고 모델링도 다르게 할 수 있는 부분이라 도메인 지식이 많이 필요해 보입니다.
Reference
https://github.com/CamDavidsonPilon/lifetimes
https://www.koreascience.or.kr/article/JAKO201430756851448.pdf
'분석 Python > 구현 및 자료' 카테고리의 다른 글
| Python) list와 nested list안에 값을 기준으로 병합하는 코드 (2) | 2022.05.06 |
|---|---|
| Python) 직선 기준 점 대칭 이동 구현 (0) | 2022.04.29 |
| Python) 고객 생애 가치(CLV)에 대해서 알아보기 (0) | 2022.03.17 |
| Python) pydantic 알아보기 (1) | 2022.03.14 |
| Python) Google Calendar API 사용 방법 (0) | 2022.02.12 |