목차
Objective
이 글의 목적은 Fraud Detection과 GNN을 결합하는 방식을 배우기 위해서 글을 작성해봅니다.
Introduction to Fraud Detection
사기 탐지(Fraud Detection)는 기업이 승인되지 않은 금융 활동을 식별하고 방지할 수 있도록 하는 일련의 프로세스 및 분석입니다.
여기에는 사기성 신용 카드 거래, 도난 식별, 사이버 해킹, 보험 사기 등이 포함될 수 있습니다.
사기는 누군가가 속임수나 범죄 활동을 통해 귀하의 돈이나 기타 자산을 빼앗을 때 발생합니다.
결과적으로 효과적인 사기 탐지 시스템을 갖추면 기관에서 의심스러운 행동이나 계정을 식별하고 사기가 진행 중인 경우 손실을 최소화하는 데 도움이 될 수 있습니다.
ML 알고리즘을 기반으로 하는 사기 탐지 모델은 여러 가지 이유로 도전적입니다.
사기는 모든 일일 거래의 작은 부분을 차지하며, 그 분포는 시간이 지남에 따라 빠르게 발전하고 조사관이 모든 거래를 적시에 확인할 수 없었기 때문에 실제 거래 레이블은 며칠 후에만 사용할 수 있습니다.
그러나 대부분의 데이터 과학적 모델이 네트워크 구조와 같은 매우 중요한 것을 생략하기 때문에 전통적인 머신 러닝 방법은 여전히 사기를 감지하지 못합니다.
여기서는 소셜 네트워크와 같은 사기 탐지는 그래프의 힘을 사용함을 의미합니다.
다음 그림은 그래프 거래 네트워크의 예입니다. 은행 계좌, 신용 카드, 사람과 같은 일부 노드가 관계가 있는 것을 볼 수 있습니다.

사실, 데이터가 행과 열로 구성된 테이블 형식 데이터 모델은 데이터 고유의 복잡한 관계와 네트워크 구조를 캡처하도록 설계되지 않았습니다.
데이터를 그래프로 분석하면 예측을 위해 그 구조를 밝히고 사용할 수 있습니다.
따라서 그래프를 사용하면 많은 복잡한 문제를 처리하고 시간이 지남에 따라 변할 수 있는 다중 간선 관계가 있는 엄청난 양의 데이터에 사용할 수 있습니다. 그래프 머신 러닝은 네트워크에서 보다 관련성이 높은 기능 정보를 사용하여 사기 예측의 정확도를 향상합니다.
즉 그래프를 사용하면, 기존 방식과는 다르게 다양한 구조간의 관계를 이용해서 분석할 수 있다는 장점이 있다.
Implementation
Graph Dataset
이 튜토리얼에서는 비트코인 거래를 2가지 범주(합법 또는 불법 거래)에 속하는 실제 entities에 매핑하는 Bitcoin 데이터 세트 또는 Elliptic Data Set [1] [2]를 사용합니다.
이것은 공개 데이터 세트이며 데이터 과학 플랫폼 Kaggle에서 쉽게 다운로드할 수 있습니다.
이것은 3개의 csv 파일로 구성되며, 첫 번째 파일은 노드를 레이블(licit/illicit/unknown)로 매핑하고, 두 번째 파일은 "Id"를 사용하여 두 노드 사이의 가장자리를 소개하고 마지막 파일에는 166개의 기능을 가진 노드 ID가 있습니다.

여기서는 다음과 같은 구성으로 되어있습니다.
| Node | 트랜잭션 |
| Edge | 한 트랜잭션과 다른 트랜잭션 간의 비트코인 흐름 |
Graph Node
각 노드에는 166개의 Feature이 있으며 "합법", "불법" 또는 "알 수 없는" 엔티티에 의해 생성된 것으로 레이블이 지정되었습니다.
Graph Edge
그래프에는 203,769개의 노드(node)와 234,355개의 간선(edge)이 있으며 그림 2에서 볼 수 있듯이 클래스 1(불법)로 레이블 된 노드의 2%(4,545개)가 있으며 21%(42,019개)가 클래스 2(불법)로 레이블이 지정되어 있습니다. 나머지 거래에는 합법과 불법에 대한 레이블이 지정되지 않았습니다. 49개의 별개의 시간 단계가 있습니다.

처음 94개 특성은 트랜잭션에 대한 로컬 정보를 나타내고 나머지 72개 특성은 중앙 노드에서 한 홉 역방향/앞으로 트랜잭션 정보를 사용하여 얻은 집계된 특성으로, 이웃 트랜잭션의 최대, 최소, 표준 편차 및 상관 계수를 제공합니다. 동일한 정보 데이터(입/출력 개수, 거래 수수료 등).
따라서 이 데이터 세트를 사용하여 노드 분류 작업(node classification)을 수행합니다.
여기서 목표는 노드가 합법인지 불법인지 예측하는 것입니다.
Data transformations
3개의 csv 파일을 다운로드한 후 pandas 데이터 프레임에 로드합니다. 또한 클래스의 형식을 이름에서 정수로 다시 지정하고 기능 및 클래스 데이터 프레임을 결합합니다.
# Load data from the folder
df_features = pd.read_csv('elliptic_bitcoin_dataset/elliptic_txs_features.csv',header=None)
df_edges = pd.read_csv("elliptic_bitcoin_dataset/elliptic_txs_edgelist.csv")
df_classes =  pd.read_csv("elliptic_bitcoin_dataset/elliptic_txs_classes.csv")

# Reformat the dataframe which contains all classes of transactions into numerical values
# 0 for licit, 1 for illicit, 2 for unknown nodes
df_classes['class'] = df_classes['class'].map({'unknown': 2, '1':1, '2':0})

# Merge features and classes dataframes
df_merge = df_features.merge(df_classes, how='left', right_on="txId", left_on=0)
df_merge = df_merge.sort_values(0).reset_index(drop=True)
Edge
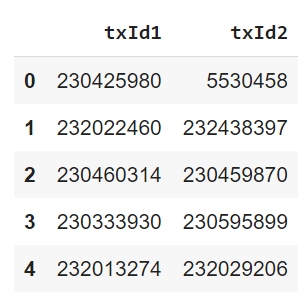
다음으로, 우리는 Graph DataSet를 생성하기 위해 3가지 다른 입력을 구성해야 합니다: edge index, node features 및 edge weights. 원래 edge data는 각 행이 에지를 나타내는 테이블이며 아래와 같이 2개의 서로 다른 노드 ID를 연결합니다.

노드 기능이 인덱스를 노드 ID로 사용하므로 트랜잭션 ID를 노드 ID로 변환합니다. 또한 [2, num of edge] 텐서로 변형해야 합니다.
이것은 torch에서 원하는 형태이기 때문에 이런 식으로의 변형이 필요합니다.
edges = df_edges.copy()

# Setup trans ID to node ID mapping
nodes = df_merge[0].values
map_id = {j:i for i,j in enumerate(nodes)} # mapping nodes to indexes

# Map transction IDs to node Ids
edges.txId1 = edges.txId1.map(map_id) #get nodes idx1 from edges list and filtered data
edges.txId2 = edges.txId2.map(map_id)
edges = edges.astype(int)

# Reformat and convert to tensor
edge_index = np.array(edges.values).T
edge_index = torch.tensor(edge_index, dtype=torch.long).contiguous()

print("shape of edge index is {}".format(edge_index.shape))
# shape of edge index is torch.Size([2, 234355])
Node
Node feature에서 이제 불필요한 변수는 제거하고, class 별로의 index만 보관을 합니다.
node_features = df_merge.drop(['txId'], axis=1).copy()
print("unique=",node_features["class"].unique())

# Retain known vs unknown IDs
classified_idx = node_features['class'].loc[node_features['class']!=2].index # filter on known labels
unclassified_idx = node_features['class'].loc[node_features['class']==2].index
classified_illicit_idx = node_features['class'].loc[node_features['class']==1].index # filter on illicit labels
classified_licit_idx = node_features['class'].loc[node_features['class']==0].index # filter on licit labels

# Drop unwanted columns, 0 = transID, 1=time period, class = labels
node_features = node_features.drop(columns=[0, 1, 'class'])

# Convert to tensor
node_features_t = torch.tensor(np.array(node_features.values, dtype=np.double), dtype=torch.double)
node_features_t

Define Data
train과 test 데이터의 index를 분리하고, 데이터 세트에는 알려지지 않은 노드가 많기 때문에 모든 노드의 전체 그래프 구조가 데이터세트에 로드되더라도 학습 및 검증은 레이블이 지정된 노드에서만 실행할 수 있습니다.
edge weight에 대한 정보가 따로 없기 때문에 기본값으로 1로 설정됩니다.
그리고 그 Data에 index를 부여합니다.
# Define labels
labels = df_merge['class'].values

#create weights tensor with same shape of edge_index
weights = torch.tensor([1]* edge_index.shape[1] , dtype=torch.double)

# Do train test split on classified_ids
train_idx, valid_idx = train_test_split(classified_idx.values, test_size=0.15)

# Create pyG dataset
data_train = Data(x=node_features_t, edge_index=edge_index, edge_attr=weights,
                               y=torch.tensor(labels, dtype=torch.double))

# Add in the train and valid idx
data_train.train_idx = train_idx
data_train.valid_idx = valid_idx
data_train.test_idx = unclassified_idx
GNN
요즘 그래프 신경망(GNN)이 점점 인기를 얻고 있습니다.
GNN은 그래프에 직접 적용할 수 있는 신경망으로 node level, edge level 및 graph level 예측 작업을 쉽게 수행할 수 있는 방법을 제공합니다.
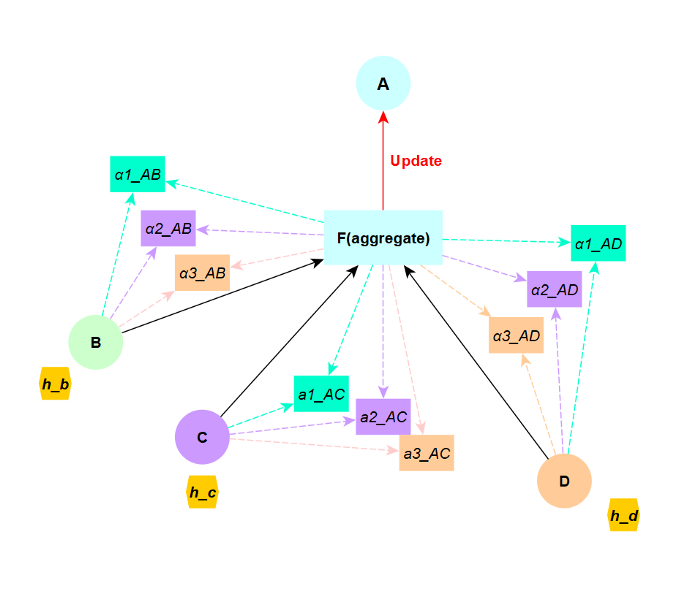
최근 몇 년 동안 GNN은 생물학, 화학, 사회 과학, 물리학 및 기타 여러 분야와 같은 많은 문제에서 중요한 발전과 성공을 보았습니다. 이는 여러 벤치마크에서 최첨단 성능으로 이어졌습니다. GNN은 다음 그림과 같이 의사 결정을 내릴 때 이웃의 정보를 집계하기 위해 메시지 전달을 수행하여 인스턴스 수준의 기능뿐만 아니라 그래프 수준의 기능도 고려합니다. 이는 이러한 종류의 작업에서 뛰어난 성능으로 이어집니다.

GNN은 information messag가 이웃 node에서 edge를 통해 전달되고 대상 node로 집계(aggregation)되는 시스템으로 그래픽 관계를 변환합니다.
각 node가 이웃의 표현(representation)을 자신의 표현(represeation)과 집계(aggregation)하고 결합(combine)하는 방법에 대해 서로 다른 많은 GNN 변형이 있습니다.
이 글에서는 GAT(Graph Attention Networks)으로 진행해보고자 합니다.
GAT(Graph Attention Networks)[4]는 Velickovic et al. 에 의해 소개된 여러 벤치마크 및 작업에서 다른 모델보다 더 나은 성능을 보이는 가장 인기 있는 GNN 아키텍처 중 하나입니다. (2018). 이 두 버전 모두 다양한 ML 분야에서 큰 성공을 보인 "Attention" 메커니즘[5]을 활용합니다.
우리는 Pytorch 위에 구축된 가장 인기 있는 그래프 딥 러닝 프레임워크인 Pytorch Geometric PyG를 사용할 것입니다. PyG는 구조화된 데이터와 관련된 광범위한 응용 프로그램에 대해 이미 구현된 풍부한 그래프 모델과 함께 GNN 모델을 빠르게 구현하는 데 적합합니다. 또한 PyG의 일부로 제공되는 GraphGym을 사용하면 몇 줄의 코드로 train/evaluation 파이프라인을 구축할 수 있습니다.
Graph Attention Networks
GraphSAGE 및 기타 널리 사용되는 GNN 아키텍처는 모든 neighbors messages에 동일한 중요성을 부여합니다(예: AGGREGATE로 평균 또는 최대 풀링).
그러나 GAT 모델의 모든 Node는 자신의 표현을 쿼리로 사용하여 이웃에 주의를 기울여 표현을 업데이트합니다.
따라서 모든 노드는 이웃의 가중 평균을 계산하고 가장 관련성이 높은 이웃을 선택합니다.
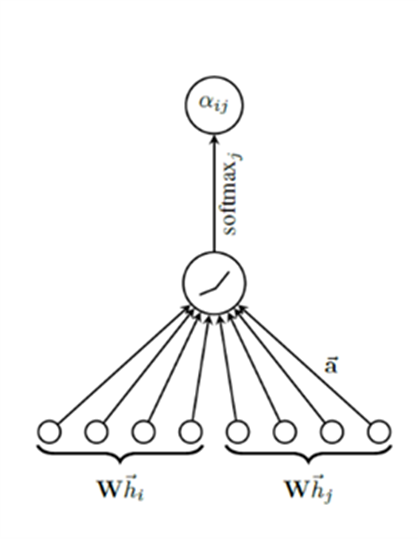
이 모델은 단일 주의 메커니즘을 보여주는 다음 그림과 같이 이웃의 다른 노드에 의해 전달되는 각 메시지의 중요성을 결정하기 위해 주의 메커니즘 α(ij)를 사용합니다.

두 이웃 간의 attention score를 계산하기 위해 scoring 함수 e는 shared attetion 메커니즘 "a"와 가중치 행렬 "W"에 의해 매개 변 수화된 공유 선형 변환이 학습되고(아래 그림 7에 설명됨), .T는 전치를 나타내고 || 방정식 1에서와 같이 벡터 연결을 나타냅니다.

attention 메커니즘 "a"는 가중치 벡터에 의해 매개변수화된 단일 레이어 피드 포워드 신경망이 될 것이며, 그 뒤에 비선형 활성화 함수(LeakyRelu)가 따라옵니다. 그래프에서 노드 i의 일부 이웃에 있는 노드 j에 대한 주의 계수 eij만 계산합니다.


그런 다음 이웃의 임베딩이 함께 집계되고 그래프의 구조적 속성(노드 차수)을 기반으로 하는 주의 점수에 따라 조정됩니다. GAT 모델은 정규화된 attention coefficient를 사용하여 i의 새로운 표현으로 이웃 노드의 변환된 특징의 가중 평균(비선형성 뒤따름)을 계산합니다.

attention 메커니즘에는 훈련 가능한 매개변수가 있고 동적이며 모든 메시지에 동일한 가중치가 부여되는 표준 그래프 Convolutional Network/GraphSAGE와 대조됩니다.

위의 그림과 같이 multi-headed Attention과 함께 GAT를 사용할 때 K independent attention 메커니즘은 이전 식 (3)의 변환을 실행하고 네트워크의 마지막 (예측) 레이어에서 연결이 더 이상 의미가 없기 때문에 || 다음 식 (4)에 표시된 연결 작업:

대신 평균을 사용하여 다음 공식을 얻습니다.

결과적으로 이 GAT 모델은 attention coefficient의 rank가 그래프의 모든 node에 대해 전역적(global)이고 그래프의 모든 node에서 공유되며 쿼리 노드(query node)에서 무조건적인 정적 주의(static attention)를 계산합니다.
attention 기능은 이웃(키) 점수와 관련하여 단조적입니다.
따라서 이 방법은 제한적이며 GAT의 표현력에 영향을 미칩니다.
Coding GAT with PyG
위에 나열된 방정식을 기반으로 PyG를 사용하여 GAT 변환 계층의 단순화된 버전을 구현할 수 있습니다. 가독성과 이해도를 높이기 위해 각 레이어의 출력에 대한 방정식과 치수를 주석 처리했습니다.
PyG는 메시지 전파(MessagePassing)를 자동으로 처리하여 이러한 종류의 메시지 전달 그래프 신경망을 만드는 데 도움이 되는 MessagePassing 기본 클래스를 제공합니다.
기본 클래스는 몇 가지 유용한 기능을 제공합니다.
첫째, message() 함수를 사용하면 각 가장자리에 전달하려는 노드 정보를 정의할 수 있고 집계 함수를 사용하면 모든 가장자리에서 대상 노드로 메시지를 병합하는 방법을 정의할 수 있습니다("추가", " 평균", "최대" 등).
마지막으로 propagate() 함수는 그래프의 모든 에지와 노드에 걸쳐 메시지 전달 및 집계를 실행하는 데 도움이 됩니다. 자세한 내용은 공식 PyG 문서에서 확인할 수 있습니다.
사전 빌드된 GATConv를 사용할 수 있지만 작동 방식을 더 잘 이해하기 위해 messagePassing 기본 클래스를 사용하여 사용자 지정 GAT 레이어를 작성하는 것으로 시작하겠습니다.
class myGAT(MessagePassing):

    def __init__(self, in_channels, out_channels, heads = 2,
                 negative_slope = 0.2, dropout = 0., **kwargs):
        super(myGAT, self).__init__(node_dim=0, **kwargs)

        self.in_channels = in_channels # node features input dimension
        self.out_channels = out_channels # node level output dimension
        self.heads = heads # No. of attention heads
        self.negative_slope = negative_slope
        self.dropout = dropout

        self.lin_l = None
        self.lin_r = None
        self.att_l = None
        self.att_r = None

        # Initialization
        self.lin_l = Linear(in_channels, heads*out_channels)
        self.lin_r = self.lin_l

        self.att_l = Parameter(torch.Tensor(1, heads, out_channels).float())
        self.att_r = Parameter(torch.Tensor(1, heads, out_channels).float())

        self.reset_parameters()

    def reset_parameters(self):
        nn.init.xavier_uniform_(self.lin_l.weight)
        nn.init.xavier_uniform_(self.lin_r.weight)
        nn.init.xavier_uniform_(self.att_l)
        nn.init.xavier_uniform_(self.att_r)

    def forward(self, x, edge_index, size = None):

        H, C = self.heads, self.out_channels # DIM:H, outC

        #Linearly transform node feature matrix.
        x_source = self.lin_l(x).view(-1,H,C) # DIM: [Nodex x In] [in x H * outC] => [nodes x H * outC] => [nodes, H, outC]
        x_target = self.lin_r(x).view(-1,H,C) # DIM: [Nodex x In] [in x H * outC] => [nodes x H * outC] => [nodes, H, outC]

        # Alphas will be used to calculate attention later
        alpha_l = (x_source * self.att_l).sum(dim=-1) # DIM: [nodes, H, outC] x [H, outC] => [nodes, H]
        alpha_r = (x_target * self.att_r).sum(dim=-1) # DIM: [nodes, H, outC] x [H, outC] => [nodes, H]

        #  Start propagating messages (runs message and aggregate)
        out = self.propagate(edge_index, x=(x_source, x_target), alpha=(alpha_l, alpha_r),size=size) # DIM: [nodes, H, outC]
        out = out.view(-1, self.heads * self.out_channels) # DIM: [nodes, H * outC]

        return out

    def message(self, x_j, alpha_j, alpha_i, index, ptr, size_i):
        # Calculate attention for edge pairs
        attention = F.leaky_relu((alpha_j + alpha_i), self.negative_slope) # EQ(1) DIM: [Edges, H]
        attention = softmax(attention, index, ptr, size_i) # EQ(2) DIM: [Edges, H] | This softmax only calculates it over all neighbourhood nodes
        attention = F.dropout(attention, p=self.dropout, training=self.training) # DIM: [Edges, H]

        # Multiple attention with node features for all edges
        out = x_j * attention.unsqueeze(-1)  # EQ(3.1) [Edges, H, outC] x [Edges, H] = [Edges, H, outC];

        return out

    def aggregate(self, inputs, index, dim_size = None):
        # EQ(3.2) For each node, aggregate messages for all neighbourhood nodes
        out = torch_scatter.scatter(inputs, index, dim=self.node_dim,
                                    dim_size=dim_size, reduce='sum') # inputs (from message) DIM: [Edges, H, outC] => DIM: [Nodes, H, outC]

        return out
이제 레이어가 모두 설정되면 실제로 이러한 컨볼루션 레이어를 사용하여 사용할 신경망을 만듭니다. 각 계층은 Relu 비선형 함수와 드롭아웃이 뒤따르는 컨볼루션 계층을 실행하는 것으로 구성됩니다. 여러 번 쌓을 수 있으며 마지막에 출력 레이어를 추가할 수 있습니다.

아래 예제 코드는 선형 MLP 출력 레이어가 있는 2개의 완전한 레이어에 대한 것입니다.
class GATmodif(torch.nn.Module):
    def __init__(self,input_dim, hidden_dim, output_dim,args):
        super(GATmodif, self).__init__()
        #use our gat message passing
        ## CONV layers - replace to try different GAT versions-----------------
        self.conv1 = myGAT(input_dim, hidden_dim)
        self.conv2 = myGAT(args['heads'] * hidden_dim, hidden_dim)
        # --------------------------------------------------------------------
        # Eg. for prebuilt GAT use
        self.conv1 = GATConv(input_dim, hidden_dim, heads=args['heads'])
        self.conv2 = GATConv(args['heads'] * hidden_dim, hidden_dim, heads=args['heads'])
        ## --------------------------------------------------------------------

        self.post_mp = nn.Sequential(
            nn.Linear(args['heads'] * hidden_dim, hidden_dim), nn.Dropout(args['dropout'] ),
            nn.Linear(hidden_dim, output_dim))

    def forward(self, data, adj=None):
        x, edge_index = data.x, data.edge_index
        # Layer 1
        x = self.conv1(x, edge_index)
        x = F.dropout(F.relu(x), p=0.5, training=self.training)

        # Layer 2
        x = self.conv2(x, edge_index)
        x = F.dropout(F.relu(x), p=0.5, training=self.training)

        # MLP output
        x = self.post_mp(x)
        return F.sigmoid(x)
Model training
모델 교육 및 평가를 위해 트레이너 및 메트릭 관리자 클래스가 생성되어 이를 훨씬 쉽게 만듭니다.
GNNtrainer는 훈련 에포크를 실행하는 데 도움이 되며 훈련 및 테스트를 더 쉽게 하기 위해 도우미 기능을 추가했습니다.
save_metrics() 함수는 훈련 중 각 에포크의 모든 주요 메트릭을 기록하는 데 도움이 되고,
save_model()은 모델이 완료된 후 저장하는 데 도움이 되며,
predict()는 모든 데이터 세트에서 예측을 실행하는 데 도움이 됩니다.
class GnnTrainer(object):

  def __init__(self, model):
    self.model = model
    self.metric_manager = MetricManager(modes=["train", "val"])

  def train(self, data_train, optimizer, criterion, scheduler, args):

    self.data_train = data_train
    for epoch in range(args['epochs']):
        self.model.train()
        optimizer.zero_grad()
        out = self.model(data_train)

        out = out.reshape((data_train.x.shape[0]))
        loss = criterion(out[data_train.train_idx], data_train.y[data_train.train_idx])
        ## Metric calculations
        # train data
        target_labels = data_train.y.detach().cpu().numpy()[data_train.train_idx]
        pred_scores = out.detach().cpu().numpy()[data_train.train_idx]
        train_acc, train_f1,train_f1macro, train_aucroc, train_recall, train_precision, train_cm = self.metric_manager.store_metrics("train", pred_scores, target_labels)


        ## Training Step
        loss.backward()
        optimizer.step()

        # validation data
        self.model.eval()
        target_labels = data_train.y.detach().cpu().numpy()[data_train.valid_idx]
        pred_scores = out.detach().cpu().numpy()[data_train.valid_idx]
        val_acc, val_f1,val_f1macro, val_aucroc, val_recall, val_precision, val_cm = self.metric_manager.store_metrics("val", pred_scores, target_labels)

        if epoch%5 == 0:
          print("epoch: {} - loss: {:.4f} - accuracy train: {:.4f} -accuracy valid: {:.4f}  - val roc: {:.4f}  - val f1micro: {:.4f}".format(epoch, loss.item(), train_acc, val_acc, val_aucroc,val_f1))

  # To predict labels
  def predict(self, data=None, unclassified_only=True, threshold=0.5):
    # evaluate model:
    self.model.eval()
    if data is not None:
      self.data_train = data

    out = self.model(self.data_train)
    out = out.reshape((self.data_train.x.shape[0]))

    if unclassified_only:
      pred_scores = out.detach().cpu().numpy()[self.data_train.test_idx]
    else:
      pred_scores = out.detach().cpu().numpy()

    pred_labels = pred_scores > threshold

    return {"pred_scores":pred_scores, "pred_labels":pred_labels}

  # To save metrics
  def save_metrics(self, save_name, path="./save/"):
    file_to_store = open(path + save_name, "wb")
    pickle.dump(self.metric_manager, file_to_store)
    file_to_store.close()

  # To save model
  def save_model(self, save_name, path="./save/"):
    torch.save(self.model.state_dict(), path + save_name)
다음으로 메트릭 관리자는 각 에포크에서 필요한 모든 메트릭을 계산하는 데 도움이 됩니다. 메트릭 관리자에는 전체 실행에 대한 최상의 결과를 계산하는 데 도움이 되는 내장 기능도 있습니다.
class MetricManager(object):
  def __init__(self, modes=["train", "val"]):

    self.output = {}

    for mode in modes:
      self.output[mode] = {}
      self.output[mode]["accuracy"] = []
      self.output[mode]["f1micro"] = []
      self.output[mode]["f1macro"] = []
      self.output[mode]["aucroc"] = []
      #new
      self.output[mode]["precision"] = []
      self.output[mode]["recall"] = []
      self.output[mode]["cm"] = []

  def store_metrics(self, mode, pred_scores, target_labels, threshold=0.5):

    # calculate metrics
    pred_labels = pred_scores > threshold
    accuracy = accuracy_score(target_labels, pred_labels)
    f1micro = f1_score(target_labels, pred_labels,average='micro')
    f1macro = f1_score(target_labels, pred_labels,average='macro')
    aucroc = roc_auc_score(target_labels, pred_scores)
    #new
    recall = recall_score(target_labels, pred_labels)
    precision = precision_score(target_labels, pred_labels)
    cm = confusion_matrix(target_labels, pred_labels)

    # Collect results
    self.output[mode]["accuracy"].append(accuracy)
    self.output[mode]["f1micro"].append(f1micro)
    self.output[mode]["f1macro"].append(f1macro)
    self.output[mode]["aucroc"].append(aucroc)
    #new
    self.output[mode]["recall"].append(recall)
    self.output[mode]["precision"].append(precision)
    self.output[mode]["cm"].append(cm)

    return accuracy, f1micro,f1macro, aucroc,recall,precision,cm

  # Get best results
  def get_best(self, metric, mode="val"):

    # Get best results index
    best_results = {}
    i = np.array(self.output[mode][metric]).argmax()

    # Output
    for m in self.output[mode].keys():
      best_results[m] = self.output[mode][m][i]

    return best_results
# Setup args and model
args={"epochs":10, 'lr':0.01, 'weight_decay':1e-5, 'prebuild':False, 'heads':2, 'num_layers': 2, 'hidden_dim': 128, 'dropout': 0.5 }
model = GATmodif(data_train.num_node_features, args['hidden_dim'], 1, args) # Change model as required, but arguments are consistent

# Push data to GPU
data_train = data_train.to(device)

# Setup training settings
optimizer = torch.optim.Adam(model.parameters(), lr=args['lr'], weight_decay=args['weight_decay'])
scheduler = torch.optim.lr_scheduler.ReduceLROnPlateau(optimizer, 'min')
criterion = torch.nn.BCELoss()

# Train
gnn_trainer_gatmodif = GnnTrainer(model)
gnn_trainer_gatmodif.train(data_train, optimizer, criterion, scheduler, args)
gnn_trainer_gatmodif.save_metrics("GATmodifhead2_newmetrics.results", path=FOLDERNAME + "/save_results/")
gnn_trainer_gatmodif.save_model("GATmodifhead2_newmetrics.pth", path=FOLDERNAME + "/save_results/")
Visualization
모델을 설정한 후 이것이 어떻게 보이는지 시각화할 수 있습니다.
첫째, 데이터 세트가 49개의 다른 기간으로 분할됨에 따라 그래프의 크기를 줄이기 위해 기간을 선택합니다.
그런 다음 NetworkX 라이브러리를 사용하여 다이어그램을 그리는 데 사용할 그래프 개체를 만듭니다.
import networkx as nx
import matplotlib.pyplot as plt

# Load model
m1 = GATv2(data_train.num_node_features, args['hidden_dim'], 1, args).to(device).double()
m1.load_state_dict(torch.load(FOLDERNAME + "/save_results/" + "GATv2_vSK2.pth"))
gnn_t2 = GnnTrainer(m1)
output = gnn_t2.predict(data=data_train, unclassified_only=False)
output

# Get index for one time period
time_period = 28
sub_node_list = df_merge.index[df_merge.loc[:, 1] == time_period].tolist()

# Fetch list of edges for that time period
edge_tuples = []
for row in data_train.edge_index.view(-1, 2).numpy():
  if (row[0] in sub_node_list) | (row[1] in sub_node_list):
    edge_tuples.append(tuple(row))
len(edge_tuples)

# Fetch predicted results for that time period
node_color = []
for node_id in sub_node_list:
  if node_id in classified_illicit_idx: #
     label = "red" # fraud
  elif node_id in classified_licit_idx:
     label = "green" # not fraud
  else:
    if output['pred_labels'][node_id]:
      label = "orange" # Predicted fraud
    else:
      label = "blue" # Not fraud predicted

  node_color.append(label)

# Setup networkx graph
G = nx.Graph()
G.add_edges_from(edge_tuples)

# Plot the graph
plt.figure(3,figsize=(16,16))
nx.draw_networkx(G, nodelist=sub_node_list, node_color=node_color, node_size=6, with_labels=False)
아래 다이어그램에는 다음과 같은 범례가 있습니다.
| 녹색 | 불법 아님 |
| 빨간색 | 불법 사기 |
| 파란색 | 불법 아님 (예측) |
| 주황색 | 불법 사기 (예측) |

그래프를 보면 대부분의 트랜잭션 노드가 클러스터에서 밀접하게 연결되어 있습니다. 실제 사기와 새 모델에서 예측된 사기는 중앙 클러스터와 더 짧은 트랜잭션 체인에 공정하게 분산됩니다.
Conclusion
Graph Attention Network는 동일한 이웃의 노드에 다른 중요도를 할당하여 모델 용량의 도약을 가능하게 하고 전체 이웃 노드에서 작동합니다.
이 튜토리얼에서는 작업 순서를 수정하여 동적 주의를 사용하는 보다 표현적인 GAT의 자세한 구현을 보여줍니다. 노이즈 에지에 더 강력합니다.
Reference
https://pytorch-geometric.readthedocs.io/en/latest/notes/installation.html
Installation — pytorch_geometric 2.0.4 documentation
pip install torch-scatter -f https://data.pyg.org/whl/torch-${TORCH}+${CUDA}.html pip install torch-sparse -f https://data.pyg.org/whl/torch-${TORCH}+${CUDA}.html pip install torch-geometric where ${CUDA} and ${TORCH} should be replaced by the specific CUD
pytorch-geometric.readthedocs.io
https://medium.com/stanford-cs224w/fraud-detection-with-gat-edac49bda1a0
Fraud detection with GAT
End to end graph attention networks models to predict bitcoin fraud cases with some neural architecture experiments and graph…
medium.com
Fraud_detection_GAT.ipynb
Colaboratory notebook
colab.research.google.com
'관심있는 주제 > GNN' 카테고리의 다른 글
| hyper graph 관련해서 도움이 되는 글들 (0) | 2022.05.08 |
|---|---|
| Python) Cora dataset을 활용하여 Link Prediction (4) | 2022.01.29 |
| GNN) GCN Layer Implementation (0) | 2021.07.03 |
| GNN) GAT Layer Implementation (0) | 2021.07.03 |
| GNN-자료 정리 (2) | 2021.07.03 |