728x90
pip install wordcloud폰트 다운로드하는 곳
https://creativestudio.kr/1734코드
import jpype
import base64
import numpy as np
import pandas as pd
from PIL import Image
from pprint import pprint
from matplotlib import font_manager, rc
from wordcloud import ImageColorGenerator, WordCloud

word = ["Statistics" , "Analysis" ,  "DATA" , "GAN",  "R", "Python" , "SQL" , "tensorflow" ,
        "ML" , "DL" ,  "Classification" , "XAI"
        "Pandas" , "Numpy" ,    "dplyr" , "ggplot" , "EDA" , "Data Handling" , "Missing" ,
        "tidyr" , "RL" , "VAE" , "AutoEncoder" , "Embedding" , "Rstudio" ,
        "OCR" ,"GPU" ,  "Text" , "NLP" ,  "Text Detection" , "Clustering" ,
        "Outlier Detection" , "Outlier" , "Summary" ,
        "tidyverse" ,  "H2O" , "UMAP" , "GMM" , "DT" , "GBM" , "RF" , "Web Service" , "UI"
        "Unsupervised Learning" , "Supervised Learning" , "Linear Regression" ,
        "EM" , "CatBoost" , "Linux" , "Ubuntu" , "Centos" ,
         "Visualization" , "Scipy" , "Multiprocessing" , "MachineLearning" , "DeepLearning" ,
         "data.table" , "Ansemble" , "tree model" , "Xgboost" , "Neural Network" , "CNN" , "RNN"
        "BayesianOptimization" , "STAT"
         "Vision" , "HiveSQL" , "Hadoop"
       ]
size = [5] * len(word)
token_docs = [(w, s) for w,s in zip(word, size)]

## ubuntu
nanum_font = "./font/NanumGothic.ttf"
font_name = font_manager.FontProperties(fname= nanum_font).get_name()
rc('font', family=font_name)
coloring = np.array(Image.open("./img/word_img.png" ))
image_colors = ImageColorGenerator(coloring)
coloring = np.where(coloring > 127 , 0 ,255)
coloring = coloring[:,:,3]
plt.imshow(coloring)
plt.show()
## https://lovit.github.io/nlp/2018/04/17/word_cloud/
tmp_data = dict(token_docs)
import numpy as np
def grey_color_func(word, font_size, position, orientation, random_state=None,
                    **kwargs):
    return "hsl(0, 0%%, %d%%)" % np.random.randint(5, 50)


wordcloud = WordCloud(
    font_path = nanum_font ,
#             relative_scaling=0.2,
    background_color= "white", # '#ffffffff'
    mask= coloring,
    width = 1000,
    height = 600,
    min_font_size=3,
    max_font_size=110,
    mode='RGBA'
)

wordcloud = wordcloud.generate_from_frequencies(tmp_data)

import matplotlib.pyplot as plt
#plt.imshow(wordcloud , interpolation="bilinear")
plt.imshow(wordcloud.recolor(color_func=grey_color_func, random_state=3),
           interpolation="bilinear")
plt.show()
wc = "./img/wordcloud_output.png"
wordcloud.to_file(wc)
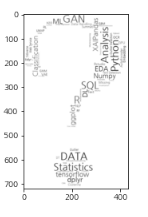
img file

'분석 Python > 구현 및 자료' 카테고리의 다른 글
| [Python] 적절한 샘플 사이즈를 찾아주는 코드 (0) | 2021.01.01 |
|---|---|
| [Jupyter] GPU 사용량 주기적으로 체크하는 코드 (0) | 2021.01.01 |
| [TIP] Class에 사전(dict)으로 property 추가하는 법 (0) | 2020.12.18 |
| [변수 선택] Genetic Algorithm를 이용 (Python) (0) | 2020.10.07 |
| [변수 선택] BorutaShap 활용 (Python) (0) | 2020.10.06 |