728x90

def vis(probs=[None,None],claess=[None,None],model_names=[None,None],label=None) :
    plt.style.use('dark_background')
    fig , ax = plt.subplots(1 , figsize = (15,15))
    plt.scatter(probs[0] , probs[1] , c = valid_y , cmap='Set3' , s = 10 , alpha = 1.0)
    ax.grid(b=False)
    plt.xlabel(model_names[0] , fontsize =20)
    plt.ylabel(model_names[1] , fontsize =20)
    cbar = plt.colorbar(boundaries=np.array([0,1,3]))
    cbar.set_ticks(np.array([0.5,2]))
    cbar.set_ticklabels(classes)
    currentAxis = plt.gca()
    someX, someY = 0.5, 0.5
    from matplotlib.patches import Rectangle
    currentAxis.add_patch(Rectangle((0, 0.5), 0.5, 0.5, fill=None, alpha=1, linewidth = 4))
    currentAxis = plt.gca()
    currentAxis.add_patch(Rectangle((0.5, 0), 0.5, 0.5, fill=None, alpha=1 ,color ="white", linewidth = 4))
    plt.show()
    return None

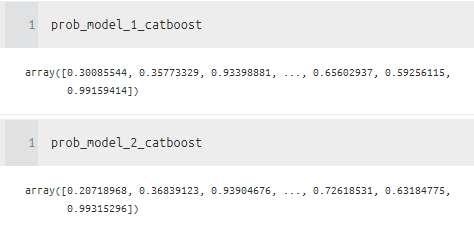
vis(probs=[prob_model_1_catboost , prob_model_2_catboost],
    claess=["No(Voted)", "Yes(Voted)"],
    model_names=["catboost-model-1","catboost-model-2"],
    label = valid_y)
여러 개의 모델들을 쌍으로 보고 싶은 경우!
def vis_comp(probs=[None,None],claess=[None,None],model_names=[None,None],label=None,ax=None) :
    ax.scatter(probs[0] , probs[1] , c = valid_y , cmap='Set3' , s = 10 , alpha = 1.0)
    ax.grid(b=False)
    ax.set_xlabel(model_names[0] , fontsize =20)
    ax.set_ylabel(model_names[1] , fontsize =20)
    from matplotlib.patches import Rectangle
    someX, someY = 0.5, 0.5
    ax.add_patch(Rectangle((0, 0.5), 0.5, 0.5, fill=None, alpha=1, linewidth = 4))
    ax.add_patch(Rectangle((0.5, 0), 0.5, 0.5, fill=None, alpha=1 ,color ="white", linewidth = 4))

plt.style.use('dark_background')
fig ,ax = plt.subplots(1,2,figsize=(15,10))
axes = ax.flatten()
vis_comp(probs=[prob_model_1_catboost , prob_model_2_catboost],
    claess=["No(Voted)", "Yes(Voted)"],
    model_names=["catboost-model-1","catboost-model-2"],
    label = valid_y,ax=axes[0])
vis_comp(probs=[prob_model_1_catboost , prob_model_lgb],
    claess=["No(Voted)", "Yes(Voted)"],
    model_names=["catboost-model-1","lgb-model-1"],
    label = valid_y,ax=axes[1])
plt.show()
0.5를 기준으로 각 모델들이 어떻게 움직이는지를 파악하고자 시각화를 함.
lgb_model 같은 경우 예측력이 애매모호하기 때문에 확률 값이 산포 되어있다는 것을 알 수 있다.
각 행마다 모델의 확실성과, 다른 모델과의 확실성에서 얼마나 차이가 나는지를 알 수 있다.
'분석 Python > Visualization' 카테고리의 다른 글
| [TIP / Vis ][plotly] 변수 중요도 시각화 하기 (bar_polar , bar plot) (0) | 2020.10.10 |
|---|---|
| [Visualization] Interact Clustering with Kmeans (with any data)(continuous) (0) | 2020.10.09 |
| [Python] scikitplot metric visualization (binary case) (0) | 2020.10.01 |
| [Python] ratio plot (0) | 2020.09.23 |
| [seaborn] clustermap, heatmap으로 시각화하기 (0) | 2020.08.20 |