728x90
확률값을 기반으로 시각화

scikitplot을 사용해서 이진 분류 관련된 메트릭들 시각화하기
- Confusion Matrix
- Roc Curve
- KS-Test(Kolmogorov-Smirnov)
- Precision-Recall Curve
- Cumulative Gains Curve
- Lift Curve
def metric_vis_binary(probs , y_label, classes=[1,2]) :
    import scikitplot as skplt
    plt.style.use('classic')
    fig , ax = plt.subplots(nrows=3 , ncols=2,figsize=(15,15))
    axes = ax.flatten()
    skplt.metrics.plot_confusion_matrix(y_label ,
                                        np.where(probs[:,1] > 0.5 ,
                                                 classes[0], classes[1]),
                                        ax=axes[0])
    skplt.metrics.plot_roc(y_label, probs,ax=axes[1])
    skplt.metrics.plot_ks_statistic(y_label, probs,ax=axes[2])
    skplt.metrics.plot_precision_recall(y_label, probs,ax=axes[3])
    skplt.metrics.plot_cumulative_gain(y_label, probs,ax=axes[4])
    skplt.metrics.plot_lift_curve(y_label, probs,ax=axes[5])
    plt.show()
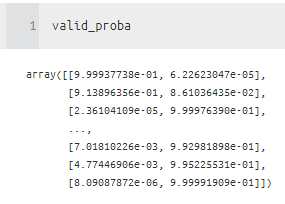
metric_vis_binary(valid_proba , valid_y, classes=[1,2])
scikit-plot.readthedocs.io/en/stable/metrics.html
Metrics Module (API Reference) — Scikit-plot documentation
Parameters: y_true (array-like, shape (n_samples)) – Ground truth (correct) target values. y_pred (array-like, shape (n_samples)) – Estimated targets as returned by a classifier. labels (array-like, shape (n_classes), optional) – List of labels to in
scikit-plot.readthedocs.io
'분석 Python > Visualization' 카테고리의 다른 글
| [Visualization] Interact Clustering with Kmeans (with any data)(continuous) (0) | 2020.10.09 |
|---|---|
| [Python] 2개 모델 비교하여 시각화 (binary case) (0) | 2020.10.01 |
| [Python] ratio plot (0) | 2020.09.23 |
| [seaborn] clustermap, heatmap으로 시각화하기 (0) | 2020.08.20 |
| [Python] 결측치 시각화 missingno 사용하기 (0) | 2020.07.23 |