광고 한 번씩 눌러주세요! 블로그 운영에 큰 힘이 됩니다 :)
이번엔 BLiTZ 개발자가 LSTM을 베이지안 뉴럴 네트워크로 구현해줬다.
요즘 LSTM 쪽을 공부하고 있는데, 또 하나의 선택지로 고민해볼 만한 것 같아서 해보기로 했다.
BLiTZ 개발자는 종가 데이터만을 넣고 하루 뒤 종가를 예측하는 것을 예제로 보여줬고,
필자는 'Open', 'High', 'Low', 'Close', 'Volume' 총 5가지 input을 주고 하루 뒤 Close를 예측하는 것을 해봤다.


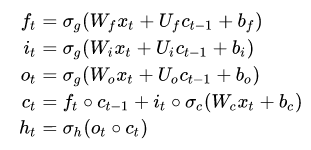
우리가 알고 있는 LSTM의 형태이다. 여기서 W,Bias를 determinstic 하게 사용하지 않고 분포에서 샘플링으로 하는 것이 이 패키지의 베이지안 방법이다.

## Data Normalizing
scaler = StandardScaler()
ycol = ["Close"]
xcol = ['Open', 'High', 'Low', 'Close', 'Volume']
xxcol = ['Open', 'High', 'Low', 'Volume']
close_prices_unscaled = df["Close"]
df[xxcol] = scaler.fit_transform(df[xxcol])
y_scaler = StandardScaler()
df[ycol] = y_scaler.fit_transform(df[ycol])
## LSTM Bayesian Network
@variational_estimator
class NN(nn.Module):
    def __init__(self, usecol_n):
        super(NN, self).__init__()
        self.lstm_1 = BayesianLSTM(usecol_n, 10)
        self.linear = nn.Linear(10, 1)

    def forward(self, x):
        x_, _ = self.lstm_1(x)

        #gathering only the latent end-of-sequence for the linear layer
        x_ = x_[:, -1, :]
        x_ = self.linear(x_)
        return x_
기존 코드와 달라진 점은 각 Time Step마다 1개의 인풋을 가졌던 부분이 usecol_n개 만큼으로 변했다는 것이다.
(BATCH , TIME STMEP , 1) -> (BATCH , TIME STMEP , Multi input)
전처리하고 split 한 데이터를 torch tensor dataset으로 사용한다.
ds = torch.utils.data.TensorDataset(X_train, y_train)
dataloader_train = torch.utils.data.DataLoader(ds, batch_size=8, shuffle=True)
net = NN(len(xcol))
criterion = nn.MSELoss()
optimizer = optim.Adam(net.parameters(), lr=0.001)
학습 코드는 그대로 사용하면 되는 것을 알 수 있다.
iteration = 0
for epoch in range(50):
    for i, (datapoints, labels) in enumerate(dataloader_train):
        optimizer.zero_grad()

        loss = net.sample_elbo(inputs=datapoints,
                               labels=labels,
                               criterion=criterion,
                               sample_nbr=3)
        loss.backward()
        optimizer.step()

#         iteration += 1
    if epoch % 10 ==0:
        preds_test = net(X_test)[:,0].unsqueeze(1)
        loss_test = criterion(preds_test, y_test)
        print("Epoch: {} Val-loss: {:.4f}".format(str(epoch), loss_test))
pred_stock_future 함수에서 multi input을 받을 수 있게 수정하였다.
중간에 보면 pred 객체를 만드는 부분이 있는데, 바로 이 부분이 가중치에서 샘플링을 통해서 한 데이터 포인트에서 여러 개의 예측값을 만들어낼 수 있다.
def pred_stock_future(X_test,future_length,sample_nbr=10,TIME_STEPS=None):

    #sorry for that, window_size is a global variable, and so are X_train and Xs
    global X_train
    global dataX

    #creating auxiliar variables for future prediction
    preds_test = []
    test_begin = X_test[0:1, :, :]
    test_deque = deque(test_begin[0,:,0].tolist(), maxlen=TIME_STEPS)

    idx_pred = np.arange(len(X_train), len(dataX))

    #predict it and append to list
    for i in range(len(X_test)):
        #print(i)
#         as_net_input = torch.tensor(test_deque).unsqueeze(0).unsqueeze(2)
        as_net_input = X_test[[i],:,:]
        pred = [net(as_net_input).cpu().item() for i in range(sample_nbr)]


        test_deque.append(torch.tensor(pred).mean().cpu().item())
        preds_test.append(pred)

        if i % future_length == 0:
            #our inptus become the i index of our X_test
            #That tweak just helps us with shape issues
            test_begin = X_test[i:i+1, :, :]
            test_deque = deque(test_begin[0,:,0].tolist(), maxlen=TIME_STEPS)

    #preds_test = np.array(preds_test).reshape(-1, 1)
    #preds_test_unscaled = scaler.inverse_transform(preds_test)

    return idx_pred, preds_test
상한 하한을 구하는 함수를 그대로 적용한다.
future_length=7
sample_nbr=4
ci_multiplier=10
idx_pred, preds_test = pred_stock_future(X_test, future_length, sample_nbr, TIME_STEPS=TIME_STEPS)
pred_mean_unscaled, upper_bound_unscaled, lower_bound_unscaled =\
get_confidence_intervals(preds_test,ci_multiplier, y_scaler)
y = df.iloc[idx_pred,:]["Close"].values.reshape(-1,1)
under_upper = upper_bound_unscaled > y
over_lower = lower_bound_unscaled < y
total = (under_upper == over_lower)
print("{} our predictions are in our confidence interval".format(np.mean(total)))params = {"ytick.color" : "w",
"xtick.color" : "w",
"axes.labelcolor" : "w",
"axes.edgecolor" : "w"}
plt.rcParams.update(params)
plt.title("IBM Stock prices", color="white")
plt.plot(df_pred.index,
df_pred.Close,
color='black',
label="Real")
plt.plot(idx_pred,
pred_mean_unscaled,
label="Prediction for {} days, than consult".format(future_length),
color="red")
plt.fill_between(x=idx_pred,
y1=upper_bound_unscaled[:,0],
y2=lower_bound_unscaled[:,0],
facecolor='green',
label="Confidence interval",
alpha=0.5)
plt.legend()
위의 그림에서 confidence interval이 굉장히 커서 불안정해보이는 것을 확인할 수 있다.
params = {"ytick.color" : "w",
          "xtick.color" : "w",
          "axes.labelcolor" : "w",
          "axes.edgecolor" : "w"}
plt.rcParams.update(params)

plt.title("IBM Stock prices", color="white")


plt.fill_between(x=idx_pred,
                 y1=upper_bound_unscaled[:,0],
                 y2=lower_bound_unscaled[:,0],
                 facecolor='green',
                 label="Confidence interval",
                 alpha=0.75)

plt.plot(idx_pred,
         df_pred.Close[-len(pred_mean_unscaled):],
         label="Real",
         alpha=1,
         color='black',
         linewidth=0.5)

plt.plot(idx_pred,
         pred_mean_unscaled,
         label="Prediction for {} days, than consult".format(future_length),
         color="red",
         alpha=0.5)

plt.legend()
실제 예측하는 부분만 보는 코드이다. 여기서 각 값에 대한 불확실성을 표현해준다.
기존에는 할 수 없던 불확실성을 표현해주는 베이지안 방법론의 큰 장점인 것 같다.
계속 패키지를 업그레이드 해주는 Blitz 개발자에게 감사함을 느낀다!
piEsposito/blitz-bayesian-deep-learning
A simple and extensible library to create Bayesian Neural Network layers on PyTorch. - piEsposito/blitz-bayesian-deep-learning
github.com
Bayesian LSTM on PyTorch — with BLiTZ, a PyTorch Bayesian Deep Learning library
It’s time for you to draw a confidence interval around your time-series predictions — and now that’s is easy as it can be.
towardsdatascience.com
'ML(머신러닝) > Bayesian' 카테고리의 다른 글
| [Pyro] Bayesian Regression 해보기 (0) | 2020.09.29 |
|---|---|
| BLiTZ — A Bayesian Neural Network 해보기 (0) | 2020.04.11 |
| (개인 공부) Markov Chain 정의 도박사 파산의 예시 및 다른 예시 (0) | 2020.03.29 |
| Credible Interval(신용구간) , Confidence Interval(신뢰구간) 차이 (1) | 2019.11.11 |
| Bayesian 가우시안 기저 모형을 활용한 Linear 예측(R) (0) | 2019.03.26 |