도움이 되셨다면, 광고 한번만 눌러주세요. 블로그 관리에 큰 힘이 됩니다.
실제 데이터를 가지고 머신러닝을 하다 보면, 종종 불균형 데이터셋에 대해서 분석을 해야 할 때가 있다.
재표본 방법 특히 undersampling 방법은 보통 클래스 불균형을 극복하기 위해서 사용되는 방법 중 하나이다.
미디엄의 저자도 이것을 관련해서 썻다고 한다. (참고하면 될 것 같다!)
(I also showed how those resampling methods worked on my Master dissertation in the other medium post)

그러나 이러한 방법을 시행하는 것은 train set과 test set에서 다른 class 분포 때문에 false positive(FP)가 증가하게 되는 경향이 있다. undersampling 방법은 분류기에 편향을 줄 수 있고 FP도 증가시킬 수 있다.
[1] Pozzolo, et al., (2015) 은 우리는 베이즈 최소 위험 이론을 사용하여 과소 표본으로 인한 편견을 수정할 수 있다고
주장한다고 한다. Bayes Minimum Risk Theory가 올바른 분류 Threshold를 찾게 도와준다고 말한다.

Content
- How does Probability Calibration work?
- Experiment
- Conclusion
1. How does Probability Calibration work?
위에서 언급한것을 간략히 말하면, undersampling은 사후 확률에 bias를 생기게 할 수 있다.
이것은 무작위 과소 표본의 특징 때문이며, 두 클래스가 동일한 관측 개수를 가질 때까지 임의로 제거하여 다수 클래스를 축소시킨다. 이것은 train set의 class 분포와 test set의 class 분포를 다르게 만든다.
그러면 어떻게 Bayes Minimum Riks Theory를 사용하여 probability calibration(확률 보정?)은 이 문제에 정확히 어떻게 작용할까? 이 방법의 기본 아이디어는 undersampling 비율 β 를 사용하여 무작위 과소 샘플링으로 발생하는 bias를 제거하거나 줄인다는 것이다.
p_s는 랜덤 샘플링 후 positive class가 되는 예측의 확률 값이라고 하자.

그리고 p는 불균형 데이터셋에서 feature로 주어진 예측의 확률이라 하자. 그러면 다음과 같은 p_s와 p의 함수를 쓸 수 있다.

β 는 under sampling에 negative class가 선택되는 확률이라고 하자.


이것을 잘 어떻게 하면 이런 식을 얻을 수 있다.
β 를 적용하면 우리는 편향이 없어지는 확률 p값을 계산할 수 있게 된다.

그것의 threshold는 데이터셋에서 positive class의 확률이라고 할 수 있다. (??)
The threshold for this is can be which is a probability of a positive class in a dataset.


이러한 방법이 Bayes Minimum Risk Theory를 사용한 Probability calibration이 간략한 소개이다.
일단 여기까지 드는 느낌은 일단 undersampling으로 모델에서 나온 확률값이 bias가 있을 수 있으니 이것을 보정하는 것인데 보정할 때 Beta값을 사용해서 보정하겠다는 것이고, 그것을 이용하면 unbias 확률 값을 얻을 수 있다! 이런 느낌인 듯.
캐글 데이터에서 가져와서 모델링하겠다 이소리 인 듯
## config
import numpy as np
import pandas as pd
import matplotlib.pyplot as plt
import seaborn as sns
import io, os, sys, types, gc, re
from sklearn import preprocessing
from sklearn.linear_model import LogisticRegression
from sklearn.model_selection import train_test_split
from sklearn.metrics import average_precision_score,
confusion_matrix, precision_score, recall_score, precision_recall_curve, f1_score, log_loss
from sklearn.decomposition import PCA
pca = PCA(n_components=1,random_state=42)
from imblearn.under_sampling import RandomUnderSampler
rus = RandomUnderSampler(random_state=42)
from imblearn.ensemble import BalancedBaggingClassifier
from src.functionalscripts.BMR import *
def make_prediction(model,X,threshold):
    y_pred = model.predict_proba(X)
    y_predicted = np.where(y_pred[:,1]>=threshold,1,0)
    return y_pred, y_predicted
def evaluation(true, pred):
    print('F1-score: ' + str(round(f1_score(true,pred),4)), '\n'
'Precision: ' + str(round(precision_score(true,pred),4)), '\n'
'Recall: ' + str(round(recall_score(true,pred),4)), '\n'
'Log loss: ' + str(round(log_loss(true,pred),4)), '\n'
'Cohen-Kappa: ' + str(round(cohen_kappa_score(true,pred),4)), '\n'
'Confusion matrix:' + '\n' + str(confusion_matrix(true,pred)))

# read the data
df = pd.read_csv('src/resources/data/creditcard.csv')
일단 target1의 전체 비율을 보자 그러면 0.17%로 굉장히 차이가 나는 데이터라는 것을 알 수 있다고 한다.
# The percentage of positive class in this dataset
len(df[df['Class']==1])/len(df)
저자는 logistic regression을 사용할 꺼라서 normalize를 L2로 한다고 함.
궁금해서 장점을 찾아보는 중...
https://intellipaat.com/community/21726/feature-normalization-advantage-of-l2-normalization
# Normalise the Amount feature
df['amt'] = preprocessing.normalize(np.array(df['Amount']).reshape(-1,1),
norm='l2')
L2 normalization can be useful when you want to force learned embeddings to lie on a sphere or something like that, but I'm not sure this function is intended for use in a data preprocessing scenario like you describe.
(https://stats.stackexchange.com/questions/336743/what-are-the-benefits-of-l2-data-normalization-over-other-normalization-techniqu)
음 몇 가지 그림을 그려봤는데, 썩 유쾌한 결과는 아니다. L2를 했을 때 먼가 좀 더 똥글똥글하게 잘 임베딩 돼서 만들어질 줄 알았는데, 그런 건 아니었다. 암튼 딴 길로 좀 샜고


# Split the dataset into train and test, and drop unnecessary features
tr, te = train_test_split(df.drop(['Amount','Time'],1), test_size=.2,random_state=42)
# Rundom Under Sampling (RUS)
####################
tr_x_rus, tr_y_rus = rus.fit_resample(tr.drop(['Class'],1),tr.Class)
# See the class distribution with features
feats_distribution_rus = pd.DataFrame(pca.fit_transform(tr_x_rus),columns=['after']).reset_index(drop=True)
feats_distribution_rus['Class'] = tr_y_rus
sns.regplot(x='after',y='Class',data=feats_distribution_rus,logistic=True, n_boot=500, y_jitter=.03)
plt.title('Class distribution of training set after undersampling')
plt.show()
왼쪽 상단을 보면 그냥 했을 때 왼쪽 아래는 undersampling을 사용하고 나서의 그림이다.
이 그림으로 봤을 때 우리가 알 수 있는 것은 undersampling 하기 전과 후과 유사하다는 것을 알 수 있다.
반면에 train set에서는 꽤 다른 분포를 나타내는 것을 알 수 있다.
왜 이렇게 차이가 나는 걸까?
# Logistic regression
logit = LogisticRegression(random_state=42,solver='lbfgs',
max_iter=1000)
# Rundom Under Sampling (RUS)
tr_x_rus, tr_y_rus = rus.fit_resample(tr.drop(['Class'],1),tr.Class)
logit_rus = logit.fit(tr_x_rus,tr_y_rus)
# RUS bagging
bc = BalancedBaggingClassifier(base_estimator=logit,random_state=42)
logit_bc = bc.fit(tr.drop(['Class'],1),tr.Class)
자 이제 대망의 Bayes Minimum Risk Theory를 적용해서 probability calibration( 확률 보정 )을 해보자!
######## 이 부분의 이 글의 핵심 이것만 봐도 됨 ##########
# BMR (Bayes Minimum Risk) implementation
# Pozzolo et al., 2015, Calibrating Probability with Undersampling

class BMR:
    def beta(binary_target):
        return binary_target.sum()/np.where(binary_target==0,1,0).sum()

    def tau(binary_target):
        return binary_target.sum()/len(binary_target)

    def calibration(prob, beta):
        return prob/(prob+(1-prob)/beta)
# Calibration
beta = BMR.beta(tr.Class)
tau = BMR.tau(tr.Class,beta)
# with RUS
y_pred_calib_rus = BMR.calibration(prob=logit_rus.predict_proba(te.drop(['Class'],1))[:,1],beta=beta)
y_predicted_calib_rus = np.where(y_pred_calib_rus>=tau,1,0)
# wtih RUS bagging
y_pred_calib_bc = BMR.calibration(prob=logit_bc.predict_proba(te.drop(['Class'],1))[:,1],beta=beta)
y_predicted_calib_bc = np.where(y_pred_calib_bc>=tau,1,0)
이제 결괏값에 대한 확률 값과 beta값을 넣어서 아래아 같이 p값을 구하는 식을 진행한다. threshold는 tau로 진행한다.

그리고 나온 값을 evaluation을 진행한다. 여기서 threshold는 0.5로 하였다!
# Evaluation
## Random Under Sampling (RUS)
y_pred_rus, y_predicted_rus = make_prediction(model=logit_rus, X=te.drop(['Class'],1), threshold=.5)
evaluation(te.Class, y_predicted_rus)
## RUS + Bagging
y_pred_bc, y_predicted_bc = make_prediction(model=logit_bc, X=te.drop(['Class'],1), threshold=.5)
evaluation(te.Class, y_predicted_bc)
## Calibration with Rundom undersampling
evaluation(te.Class, y_predicted_calib_rus)
## Calibration with RUS bagging
evaluation(te.Class, y_predicted_calib_bc)
근데 결괏값을 보니 probabilty calibration이 아무것도 변하지 않았다!!!(이런!)
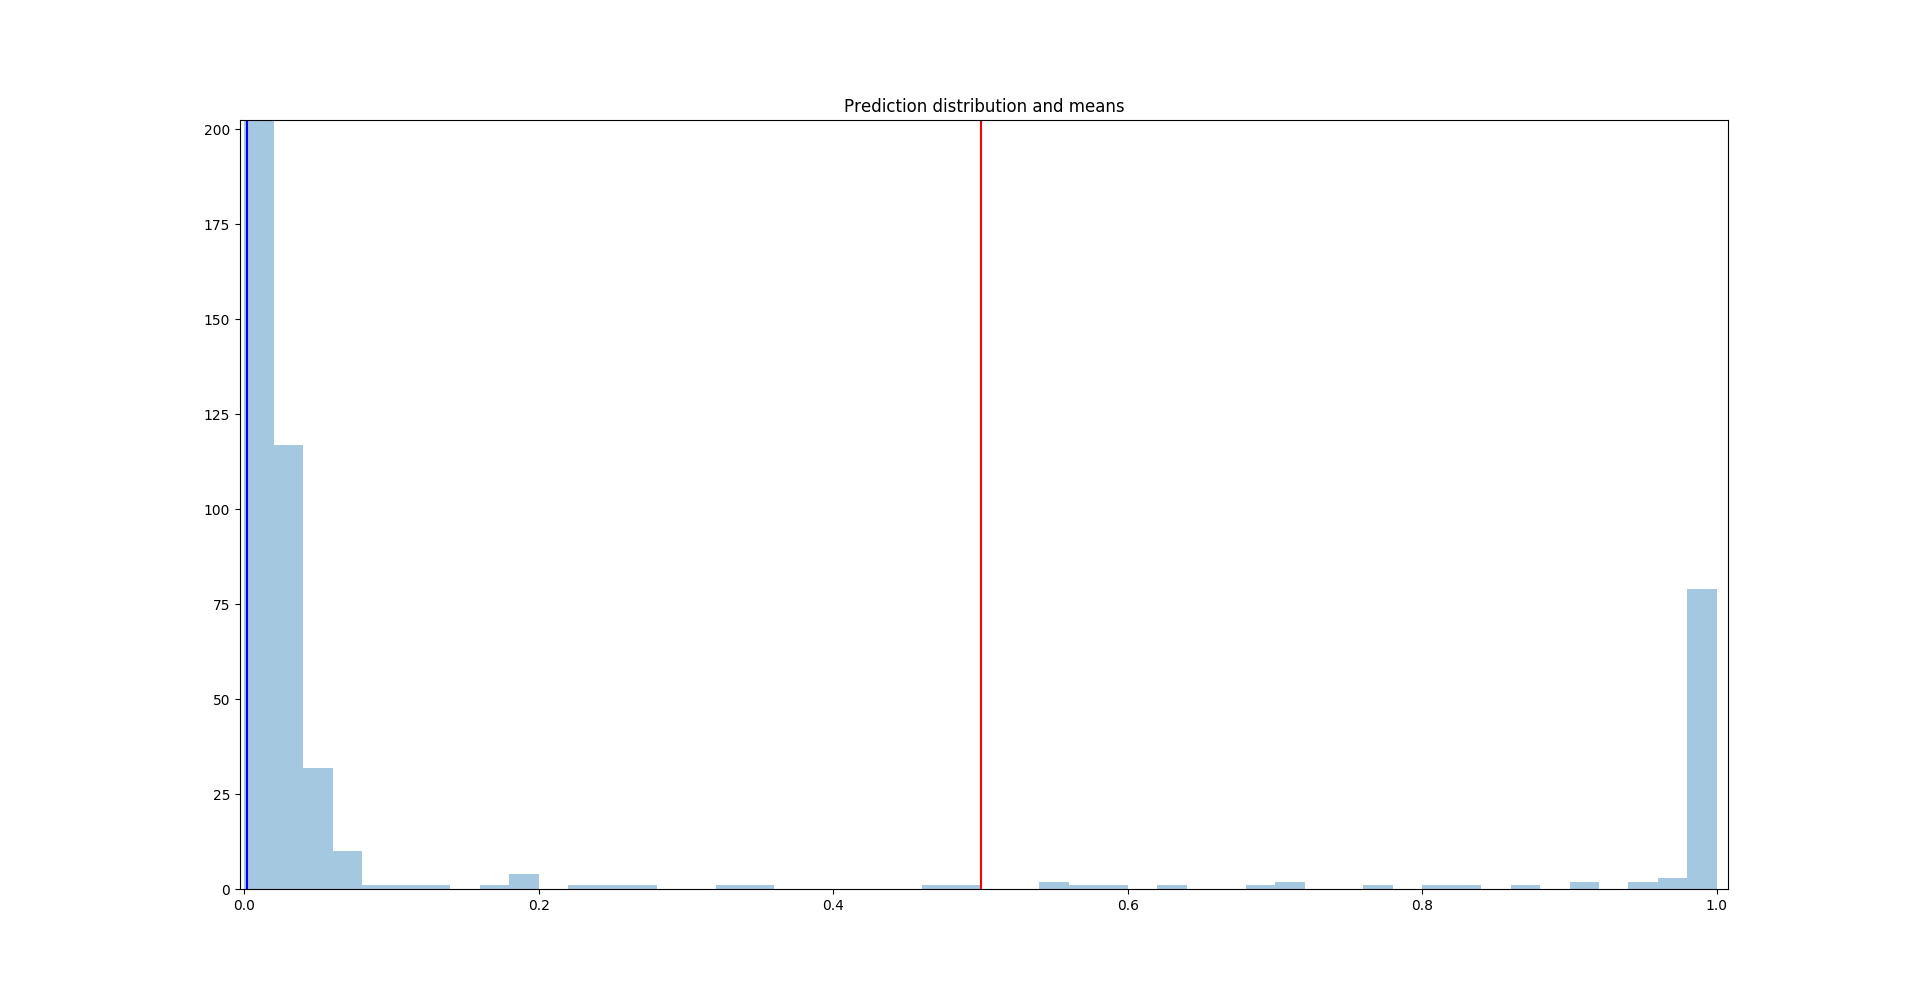
먼가 잘못된 것이 틀림없다. 여기서 RUS Bagging with calibration을 예측 확률 분포를 보자.
파란색 수직 선은 RUS Bagging with calibration의 예측 확률 값의 평균이다. 그리고 빨간색 수직 선은 RUS Bagging 모델의 예측 확률의 평균이다. 보정된 확률 평균이 0.0021이고 보정 전 평균이 0.5이기 때문에 이들의 평균은 상당히 멀다.
positive class가 전체 데이터셋에서 0.17% 밖에 없다는 것을 고려한다면, calibrated probability는 꽤 실제 분포와 가까운 것이다.

만약에 threshold를 수정한다면 더 나은 결과를 얻을 수 있을 것이다. RUS Model에서 calibration 전과 후에 threshold는 0.99 calibration with RUS Bagging 은 0.8로 설정하면 다음과 같은 결과를 얻을 수 있다!
이전과 다르게 좋아진 성능을 확인할 수 있다.

확률 보정을 사용함으로써, 더 나은 성능을 얻을 수 있게 되었다!
저자는 이 방식을 사용하면 undersampling을 하였을 때 train과 test의 분포 같은 이슈와 유사한 시계열 문제에 실제 훈련된 모델과 꽤 다를 때도 사용할 수 있다고 한다.
그리고 이러한 방법론은 logistic 뿐만 아니라 tree-based model이나 Neural Network에도 적용할 수 있다.
- 결론
개인적으로 흥미롭게 읽었던 글이다.
Imbalanced 문제에 대해서 확률 보정에 대해서는 생각해본 적도 없고, 하는 방법도 몰랐는데, 이번 글에서 가능성을 보게 된 것 같아 기쁘다.
단순히 oversampling이나 undersampling 방법만 적용하기보다는 이런 식으로 확률 보정을 하게 된다면, 더 좋은 성능을 기대할 수 있을 것 같다.