728x90
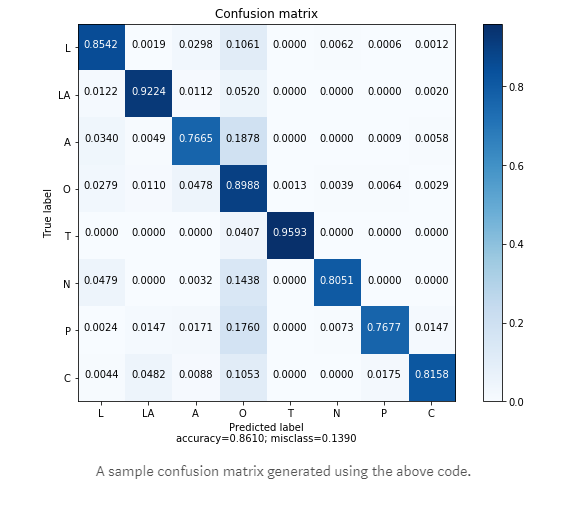
“How to plot wholesome confusion matrix?” by Deepanshu Jindal
유용한 코드니 참고해서 사용하려고하니, 여러분도 애용하세요!
https://link.medium.com/dlmxbyUxFW
“How to plot wholesome confusion matrix?”
A place where words matter
link.medium.com
def plot_confusion_matrix(cm, target_names=None, cmap=None, normalize=True, labels=True, title='Confusion matrix'):
    accuracy = np.trace(cm) / float(np.sum(cm))
    misclass = 1 - accuracy

    if cmap is None:
        cmap = plt.get_cmap('Blues')

    if normalize:
        cm = cm.astype('float') / cm.sum(axis=1)[:, np.newaxis]

    plt.figure(figsize=(8, 6))
    plt.imshow(cm, interpolation='nearest', cmap=cmap)
    plt.title(title)
    plt.colorbar()

    thresh = cm.max() / 1.5 if normalize else cm.max() / 2

    if target_names is not None:
        tick_marks = np.arange(len(target_names))
        plt.xticks(tick_marks, target_names)
        plt.yticks(tick_marks, target_names)

    if labels:
        for i, j in itertools.product(range(cm.shape[0]), range(cm.shape[1])):
            if normalize:
                plt.text(j, i, "{:0.4f}".format(cm[i, j]),
                         horizontalalignment="center",
                         color="white" if cm[i, j] > thresh else "black")
            else:
                plt.text(j, i, "{:,}".format(cm[i, j]),
                         horizontalalignment="center",
                         color="white" if cm[i, j] > thresh else "black")

    plt.tight_layout()
    plt.ylabel('True label')
    plt.xlabel('Predicted label\naccuracy={:0.4f}; misclass={:0.4f}'.format(accuracy, misclass))
    plt.show()
'분석 Python > Visualization' 카테고리의 다른 글
| Python Group 별로 Bar Graph 그릴 때, (0) | 2019.06.09 |
|---|---|
| Python에서 RocCurve 시각화하기. (0) | 2019.05.18 |
| Jupyter에서 Plotly로 Bargraph Button 구현하기 (0) | 2019.05.12 |
| [ Python ] 이미지를 gif로 바꾸는 방법 (0) | 2019.05.11 |
| matplotlib 간단한 실습 (0) | 2018.01.02 |