분석 Python/Visualization
[ Python ] seaborn subplots x_ticklables rotate 하는 법
데이터분석뉴비
2019. 9. 13. 14:39
728x90
import seaborn as sns
fig , axes = plt.subplots(1,2)
axx = axes.flatten()
g = sns.countplot(x="dt", data=tmp , hue = "occur" , ax = axx[0] ,)
g.set_xticklabels(g.get_xticklabels(), rotation=45,
                  horizontalalignment='right',
                  fontweight='light',
                  fontsize='x-small'
                 )
g = sns.countplot(x="region", data=tmp , hue = "occur" , ax = axx[1])
g.set_xticklabels(g.get_xticklabels(), rotation=45,
                  horizontalalignment='right',
                  fontweight='light',
                  fontsize='x-small'
                 )
plt.show()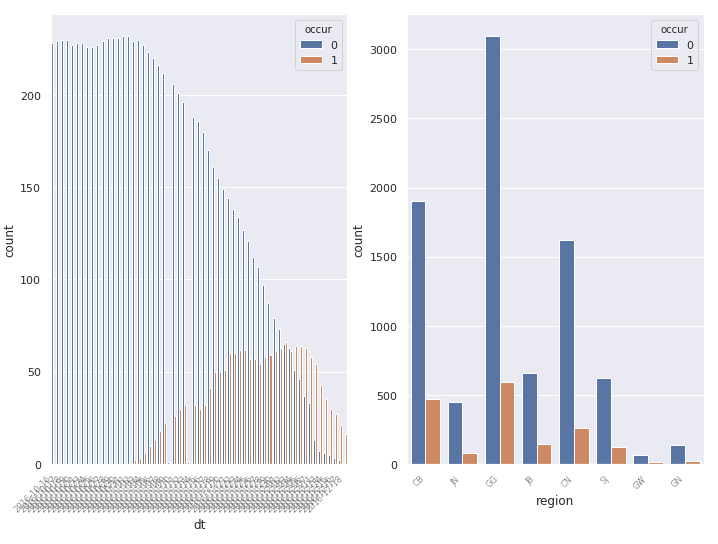
https://www.drawingfromdata.com/how-to-rotate-axis-labels-in-seaborn-and-matplotlib
How to rotate axis labels in seaborn and matplotlib — Drawing from Data
There's a common pattern which often occurs when working with charting libraries: drawing charts with all the defaults seems very straightforward, but when we want to change some aspect of the chart things get complicated. This pattern is even more noticab
www.drawingfromdata.com
728x90